Validate your test setup
This section details the features you can use to validate your testing setup. The screens addressed here are available to your users to configure, execute and report on their tests and as such, provide insight into the experience they have from using the Test Bed.
In order to test your overall setup, you are provided with a special organisation named Admin Organisation. You can use this organisation as any other organisation used within your community to engage in testing activities. Through this organisation you can:
Manage its systems, as the organisation’s components for which testing is made.
Manage its conformance statements, defining the specifications to be tested for.
Execute tests, to try out actual test sessions ensuring that your test cases are correctly setup.
View your test history, to view the tests carried out using your test organisation.
Note
The test organisation: In the documentation sections that follow, this special-purpose organisation is often referred to as “your organisation”. This indeed is the organisation that you and other administrators from your community are linked to. It should however be clear that all actions carried out using this are meant only to validate the testing setup you have configured for your community.
Manage your organisation
Note
Editing your organisation details: The “Admin Organisation” presented here is a special organisation linked to your community that is used for testing purposes. You would typically use it by configuring conformance statements and executing tests to validate your testing setup.
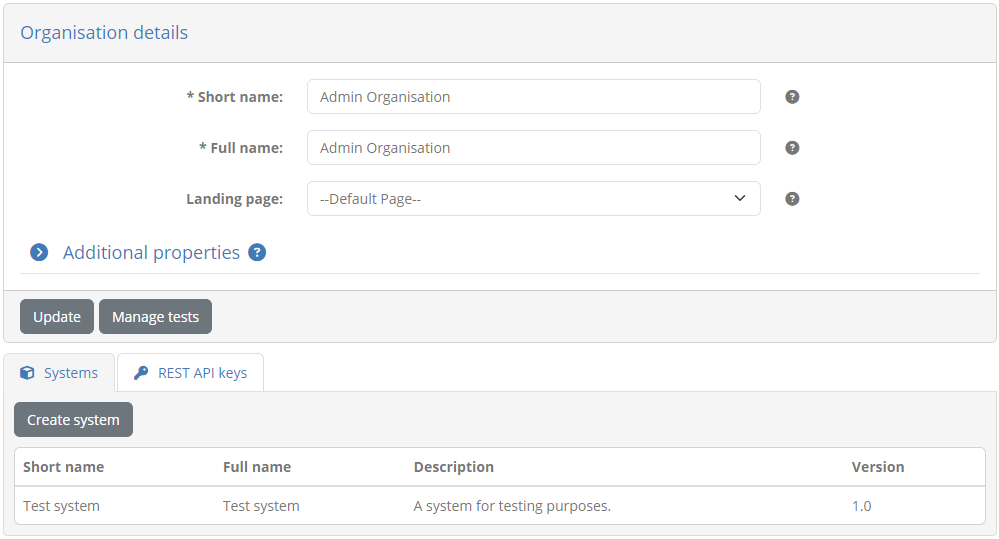
To view your organisation’s information click the My organisation link from the side menu. The screen you are presented with shows you the information relevant to your organisation, split in the following sections:
Organisation details: The name (short and full) of your organisation, as well as its currently applicable landing page.
Systems: A tab listing the systems defined for your organisation. Each listed system displays its name (short and full), description and version.
REST API keys: A tab, visible if testing via REST API is enabled, allowing you to view and manage the keys you need to use it.
If you have defined additional properties for the community’s organisations you will also see here an Additional properties section that you can click to display your organisation’s additional information.
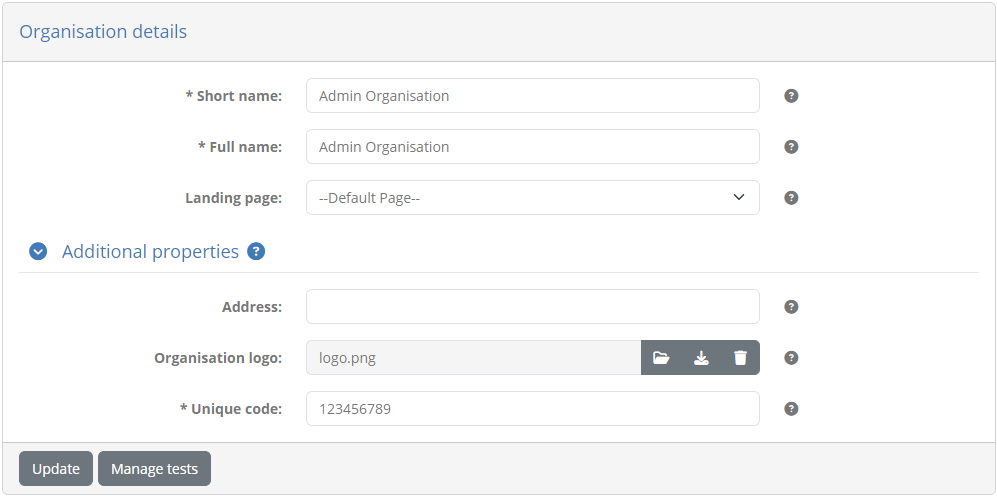
If this is expanded you will see a list of these additional properties along with their currently configured values. Such properties can be simple texts, secret values (e.g. passwords) or files and, if supplied by you, will display a help tooltip to understand their meaning.
You can view and edit these properties, depending on their type:
For texts the current value is presented in an editable text field.
For files you can upload a new file, whereas if one is already set you can download or delete it.
For secrets a read-only text field indicates whether a value is currently set, whereas to provide a new value you check Update. When providing a new value you can also toggle the display of the typed characters.
Note
Required properties are marked with an asterisk. It is is not mandatory to fill these in when editing the organisation’s information but as long as required properties are missing you will not be able to launch tests.
Update any of the existing values and click on Update to persist your changes. From here you can also review your organisation’s systems and REST API keys by clicking on their respective tabs. You may also click the Manage tests button to view your organisation’s conformance statements.
Manage your systems
Selecting the Systems tab presents the systems defined for your organisation. Systems are an important concept in the Test Bed as they represent the software components you are testing for. Before proceeding to test anything you will need to have one or more systems that you can use to define conformance statements.
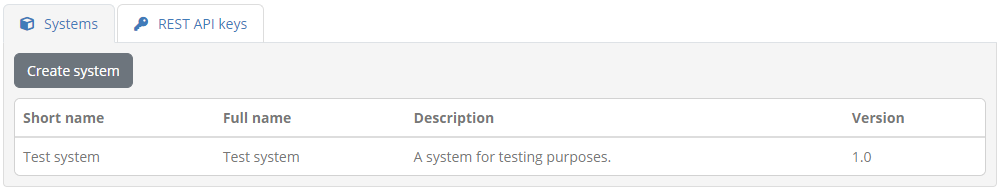
Your organisation’s systems are presented in a table that displays for each system:
Its short name, a brief name used to display in search results.
Its full name, the complete system name presented in reports and detail screens.
A description, providing additional context on the specific system.
A version number.
To view the details of a specific system you can click its row in the table. Clicking on the Create system button allows you to create a new system.
Create a new system
To create a new system click on the Create system button displayed above the listing of existing systems.
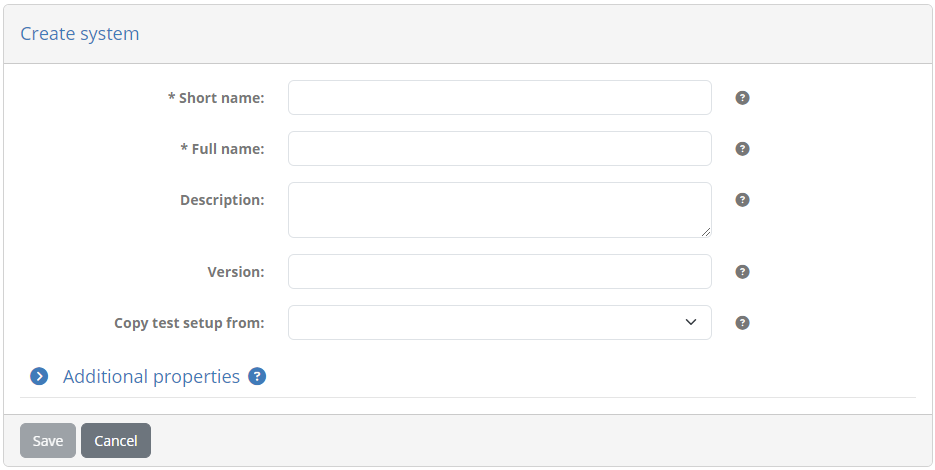
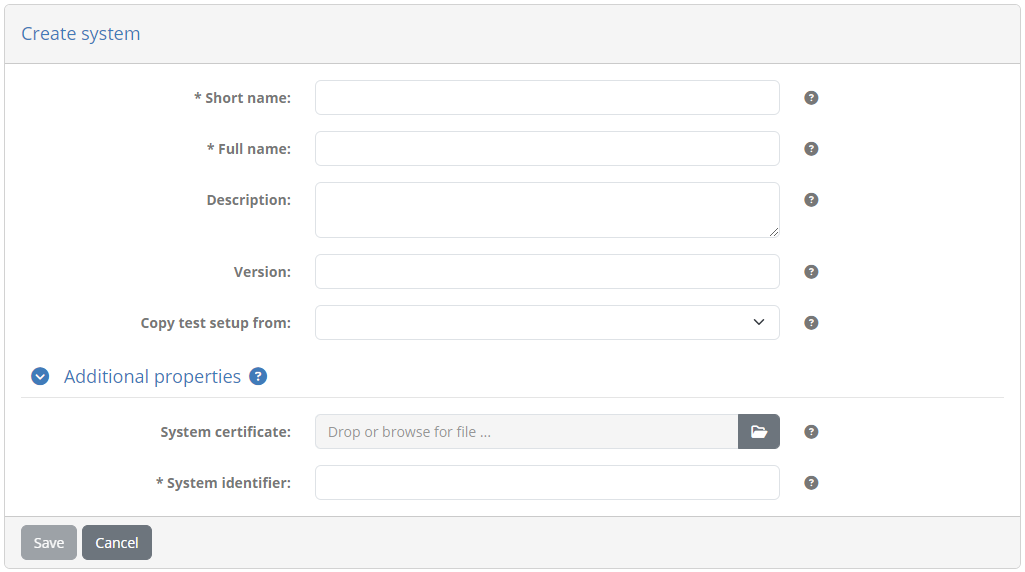
Doing so you will be presented with a screen to provide the new system’s information. The inputs presented in the form are:
The system’s short name (required). This is used when the system is displayed in lists.
The system’s full name (required). This is included in reports that mention the system.
An optional description to provide more information about the system.
A version number. Although requested this is not currently used in the Test Bed apart from display purposes.
If your organisation includes other systems you are also presented here with an option to copy the test setup from one of them as a source. Selecting one will replicate the selected system’s conformance statements for the new system.
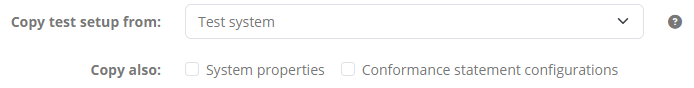
Once another system is selected to copy from, you are also presented with additional options to include:
System properties: To also copy any additional system-level properties that the source system defines.
Conformance statement configurations: To also copy any of the source system’s configuration parameters set on its conformance statements.
If your community foresees additional system properties, and as long as you are not copying the properties from another system, you will also see a Additional properties section. Clicking this expands the section so that you can manage your new system’s properties.
Configured properties can be simple texts, secret values (e.g. passwords) or files for which, if supplied by your community administrator, you will also see a help tooltip to understand their meaning. Such properties can be edited as follows:
For texts through an editable text field or by selecting a preset value from a dropdown list.
For files you can upload a new file, whereas if one is already set you can download or delete it.
For secrets a read-only text field indicates whether a value is currently set. Provide a new value by checking Update which makes the text field editable. While editing you can also toggle the display of typed characters.
Note
Required properties are marked with an asterisk. It is is not mandatory to fill these in when providing the system’s information but as long as required properties are missing you will not be able to launch tests.
Once you have entered the system’s information click the Save button to record it. You can also click the Cancel button to return to the previous screen without making any changes.
Edit an existing system
To edit an existing system click its row from the listing of existing systems. Doing so results in a screen displaying the system’s information, presented in editable input fields.
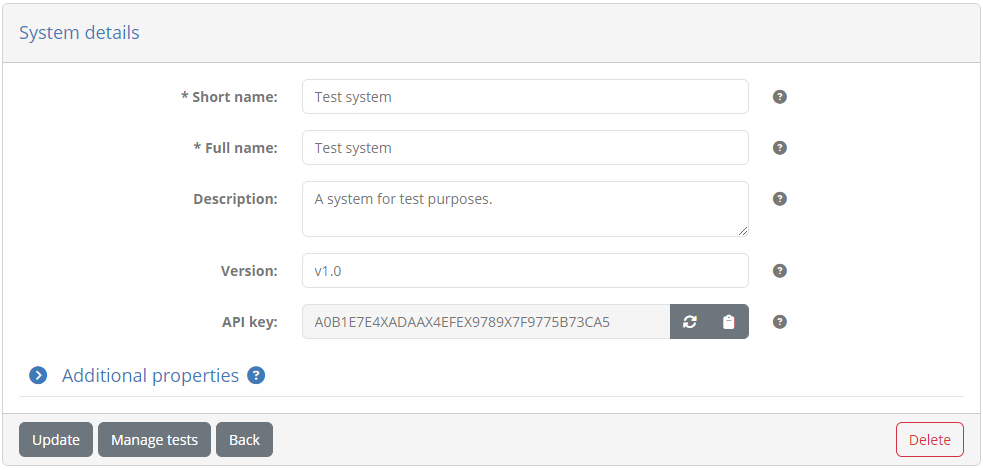
You can proceed here to modify the short name, full name, description, version. At the bottom you also see the unique API key for the system that can be clicked to copy it to the clipboard or refreshed to update it. This API key can be used in case the Test Bed’s REST API is enabled, or for messaging in test cases.
If your organisation defines other systems you can also select to copy the test setup from another system which will reset the system’s conformance statements to match the selected one (upon confirmation).
Once another system is selected to copy from, you are also presented with additional options to include:
System properties: To also copy any additional system-level properties that the source system defines.
Conformance statement configurations: To also copy any of the source system’s configuration parameters set on its conformance statements.
If your community foresees additional system properties, and as long as you are not copying the properties from another system, you will also see an Additional properties section. You can click this to expand and manage the system’s properties.
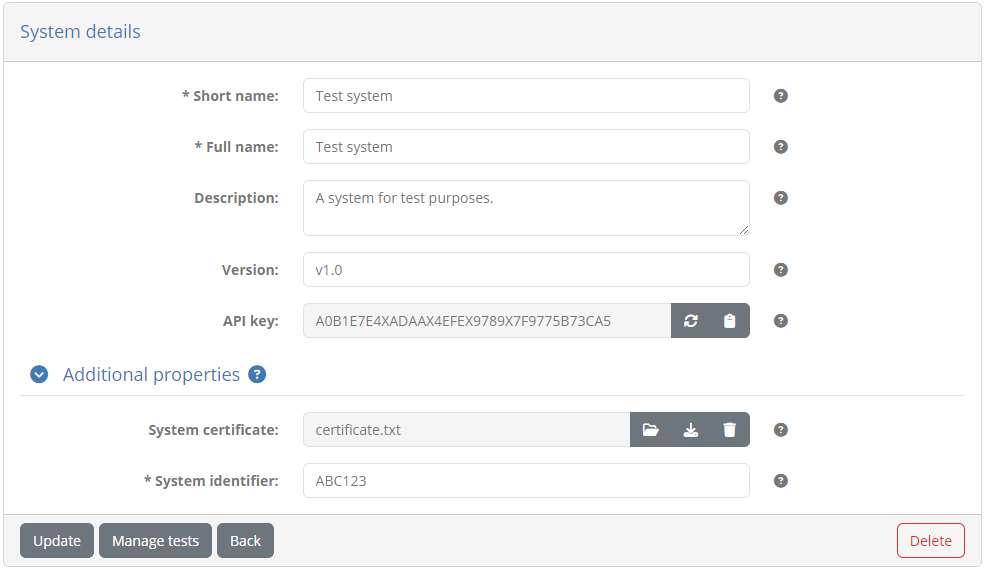
Configured properties can be simple texts, secret values (e.g. passwords) or files for which, if supplied by your community administrator, you will also see a help tooltip to understand their meaning. Such properties can be managed as follows:
For texts the current value is presented in an editable text field or dropdown menu (if the property has preset values).
For files you can upload a new file, whereas if one is already set you can download or delete it.
For secrets a read-only text field indicates whether a value is currently set, whereas to provide a new value you check Update. When providing a new value you can also toggle the display of the typed characters.
Certain properties may actually be non-editable. Such properties can only be managed by your community administrator.
Note
Required properties are marked with an asterisk. It is is not mandatory to fill these in when providing the system’s information but as long as required properties are missing you will not be able to launch tests.
Once ready click the Update button to finish. You may also click here the Manage tests button to view the system’s conformance statements, or the Delete button which, following confirmation, will proceed to completely delete the system. In case you choose to delete the system, the tests realised for it will still be searchable but will be presented as obsolete (see View your test history). Finally, you can also click the Back button to return to the previous screen without making any changes.
Manage your REST API keys
Selecting the REST API keys tab (if available) presents you the API keys to launch and manage test sessions via REST API. This tab may be missing if use of this REST API is not enabled by your administrator.
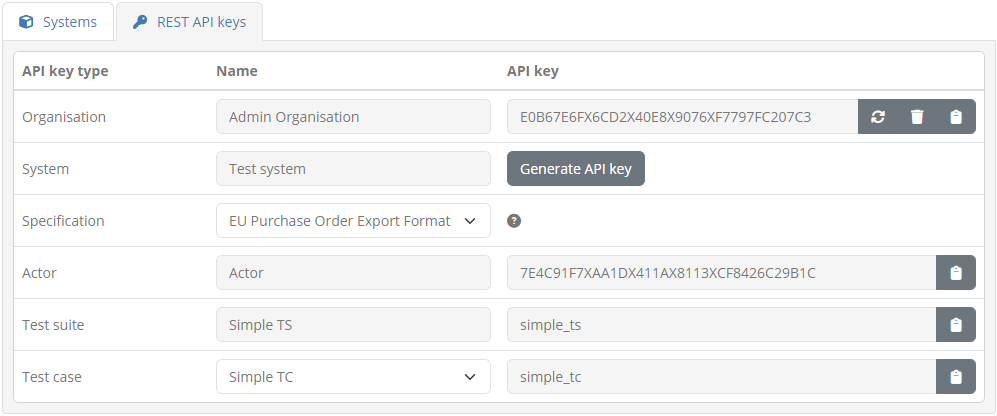
From this table you can view, manage and copy the keys you need to identify your organisation, the system to be tested and the target conformance statement and tests. These API keys are listed in a table presenting per case the key to consider. For each key you may click the provided copy control to copy it to your clipboard.
The keys listed include the following:
Organisation: The key to identify your organisation. The readonly name of the organisation is displayed alongside the key. You are also presented here with reset and delete controls to replace or remove the key.
System: The key to identify a specific system. If your organisation defines multiple systems these are presented in a dropdown list and selecting one will display its API key. The displayed key also provides a reset control to replace it.
Specification: The target specification does not itself define an API key but you need to select one to view the API keys of its related information (actors, test suites and test cases). If you have conformance statements for only a single specification this appears as preselected and readonly.
Actor: The key to identify the target specification’s actor. The actor, along with your selected system essentially constitute your target conformance statement. The selected specification’s actors are listed in a dropdown list unless there is a single one which would appear as a readonly preset selection. Selecting an actor from the list displays its related API key.
Test suite: The key to identify a specific test suite. Selecting a given test suite displays its relevant API key.
Test case: The key to identify a specific test case within the selected test suite. Selecting a given test case displays its relevant API key.
Note
The listed API keys do not include conformance snapshots. This is because your own administrator organisation is never included in snapshots.
When removing or replacing the API key of your organisation or one of its systems, you will be prompted to confirm it. If you proceed to do so any existing automation setups you may have would need to be updated accordingly given that the previous keys will no longer be valid.
Details on how these REST API keys are used to launch and manage test sessions are provided in Execution via REST API.
Note
The displayed specifications, actors, test suites and test cases are limited to those linked to your already configured conformance statements.
Manage your conformance statements
Conformance statements serve to define an organisation’s testing goals by linking one of its registered systems with a specification’s actor. It is a system’s conformance statements that determine the test suites and test cases that will be presented for execution.
Depending on your preferences you may allow organisation administrators to configure their own conformance statements or you may configure them on their behalf.
View your conformance statements
To view your organisation’s conformance statements click the My conformance statements link from the menu. Doing so presents you with a screen listing each statement and its status.
Conformance statements are made at the level of a system and as such, the first step is to select a system from the presented dropdown. If the organisation only has a single system this appears preselected and its conformance statements are automatically loaded.
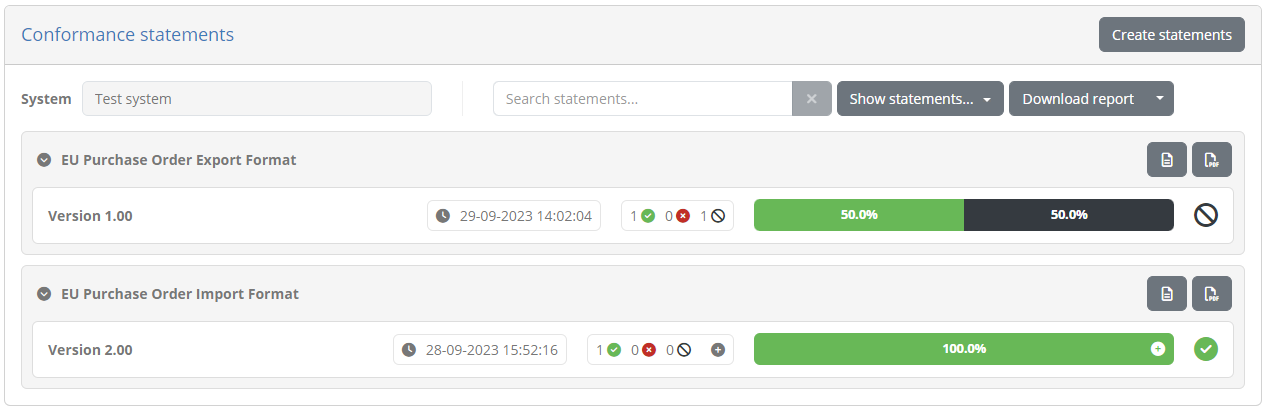
Assuming there are conformance statements defined these will be presented in expandable panels, split and grouped based on their relevant specifications, specification groups and options (if applicable). If you do indeed see such groupings, related statements can be expanded and collapsed by clicking on their relevant titles.
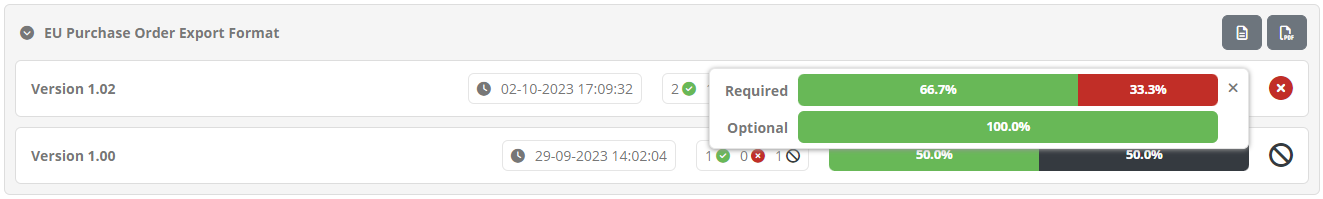
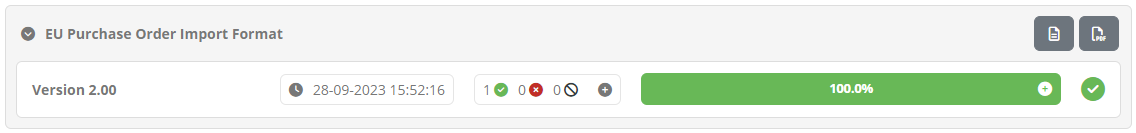
For each statement you can see besides the name of the specification, an overview of the system’s current testing status. This overview consists of:
The last update time, corresponding to the last time the status of the conformance statement was updated.
The result counts, showing the number of tests in the conformance statement that are completed, failed or incomplete.
The result ratios, illustrating the same results but as a percentage of the total tests in the statement.
The overall status of the statement which can be successful, failed, or incomplete, based on the latest test results.
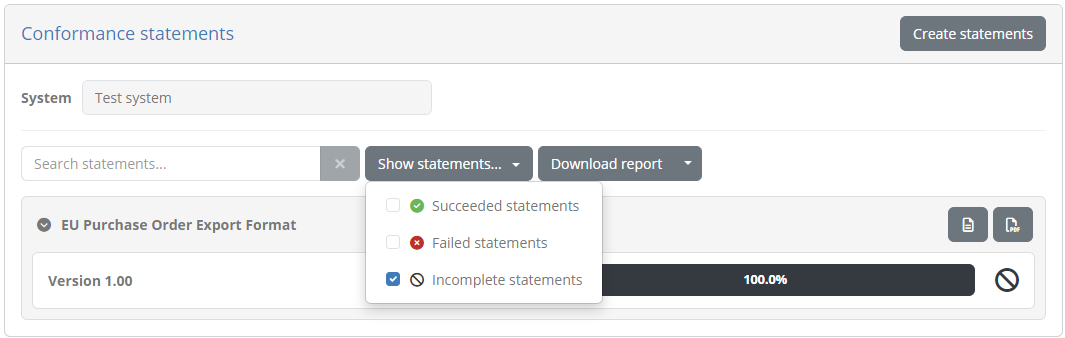
In case numerous statements are defined, you can use the provided search controls to filter them based on:
The specifications’ name.
The overall status.
It could be that certain test cases configured for the specification are optional in nature. Such tests can be consulted but are not counted towards the conformance testing status. If such optional tests exist, the displayed counts and ratios will present a plus button to expand their display allowing you to consult both mandatory and optional tests.
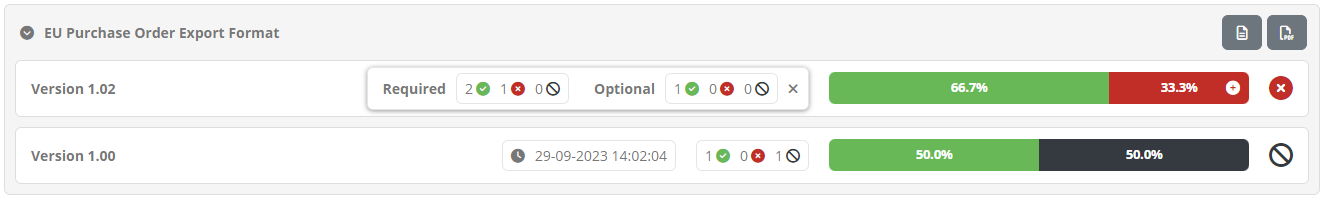
Clicking any conformance statement row will take you to the conformance statement’s details from where you can see further information on the statements’ test cases and execute new test sessions.
List view
You can switch to a list view presentation of the conformance statements at any time by toggling the List view control from the page’s header.

Doing so presents the conformance statements in a table, and enables advanced search filters allowing you to inspect specific statements of interest. The table listing statements is paged and includes one row per conformance statement.

Statements are presented in a paged table sorted based on the system’s name. Custom sorting can be applied by clicking the title of each column; clicking a column header for the first time will sort by it in ascending manner and clicking it again will switch to descending. The active sort column and type are indicated using an arrow next to the relevant column header. The table offers controls to go to specific pages as well as the first, previous, next and last ones (as applicable), while showing in the bottom right corner the total and currently displayed test counts.
The information displayed for each conformance statement is:
The system that is the focus of the testing activities.
The specification that the system is selected to conform to.
The actor of the specification the system is expected to act as.
The date and time when the conformance statement’s status was last updated.
The statement’s test results showing how many configured tests are successful, failed, or incomplete. This can also be hovered over to view a text summary of the displayed counts.
The statement’s overall status (success, failure or incomplete).
Clicking on a row from the table will take you to the conformance statement detail screen.
Export all conformance statements
It is possible to generate a CSV export including all the conformance statements currently displayed. To do so click the Export CSV button from the conformance statements’ header.

Note that the CSV export will include the conformance statement information as well as the information on the individual related test cases.

Apply search filters
When the conformance statements’ list view is active, it offers also a set of filters that can be used to select the displayed conformance statements. These can be enabled by clicking the Search filters button from the table header.
Doing so will expand the table header to present the available filter controls.

The controls that can be used for filtering are:
The relevant system.
The relevant domain (only in case your community is not linked to a specific domain).
The relevant specification group, specification and actor.
The conformance status.
The last update time for the conformance statement’s status.
Most filter controls are defined as selection choices. Multiple selected values across these controls are applied as follows:
Within a specific filter control using “OR” logic (e.g. selecting multiple specifications).
Across filter controls using “AND” logic (e.g. selecting a specification and an organisation).
Note additionally that selecting dependent values serves to limit the filter options that are presented. For example if a given specification is selected, the actors available for filtering will be limited to that specification to already exclude impossible combinations.
The presented conformance statements are automatically updated whenever your filter options are modified. The filter panel may also be collapsed and expanded by clicking again the Search filters button. In addition, you may click the caret to the right of the button to select from its options to either refresh the current results, or to clear all applied filters.

Create a conformance statement
To create a new conformance statement for the selected system click the Create statements button from the panel’s controls.

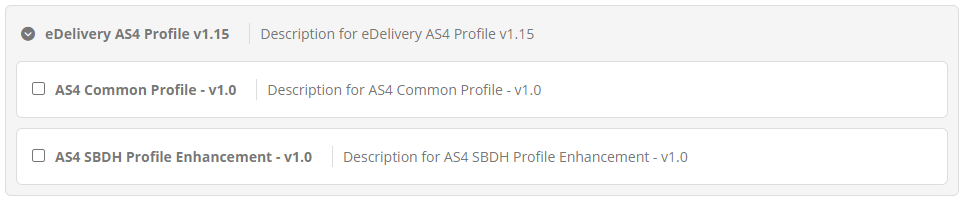
Doing so presents to you the available conformance statements that can be selected for the system.
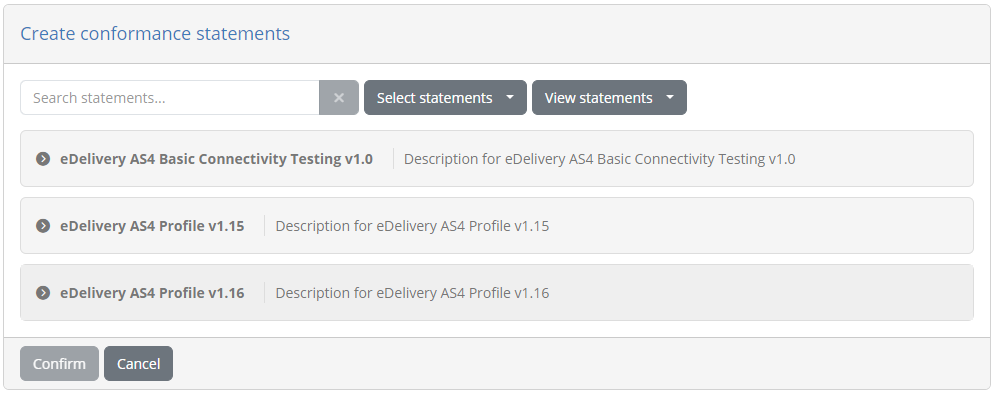
The available domains (if multiple), specifications, their groups (if applicable), and actors are organised as available conformance statements in expandable options. You may click each statement to collapse or expand it, revealing the available statements that you may select.
Above the available conformance statements you are also presented with controls to facilitate your selection.

Using these controls you may:
Search for an available statement (the search text is looked up in names and descriptions in a case-insensitive manner).
Show the currently selected or unselected statements.
Select or unselect the currently displayed statements.
Collapse or expand the displayed statements.
At the right of these controls you also see the total selected statements. When selecting statements you can make several searches and navigate between returned pages of results without losing your currently selected statements. This allows you to fine-tune the conformance statements you want to create for your system.
Once you have selected one or more statements you may click on Confirm to proceed with their creation. Clicking on Cancel will return you back to the listing of the existing conformance statements.
Conformance overview report
Besides viewing your conformance statements and their grouping on this screen, you can also generate conformance overview reports. These reports are a complement to the conformance statement reports available when viewing a specific conformance statement, focusing rather on a set of related conformance statements. Such overview reports are available at different levels depending on how specifications are configured, specifically (per decreasing aggregation level):
Your overall status as an organisation (always available).
A domain, when your conformance statements can cover more than one domains.
A specification group, if groups are defined.
A specification, when multiple actors can be tested for.
A report of your overall conformance status can be produced by clicking on the Download report button presented above the listing of statements. By default this will produce a PDF report, but clicking the presented caret for additional options allows you to also download the report in XML format.
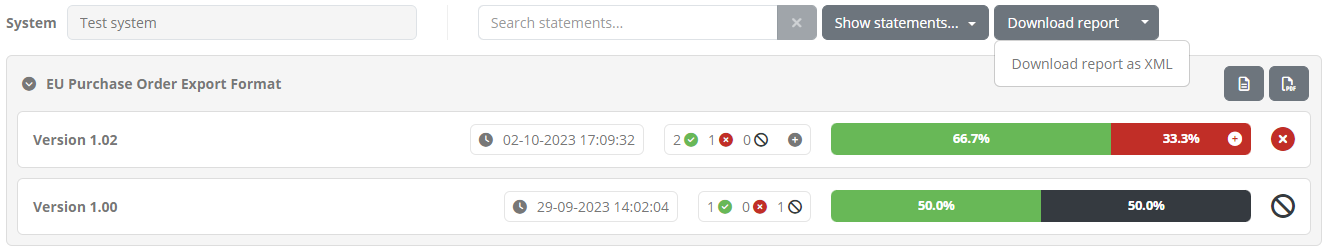
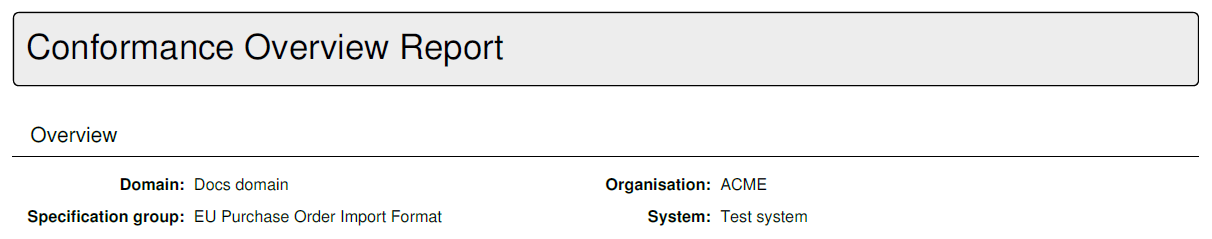
The PDF report includes an overview section summarising the report’s context and status. This includes:
The organisation and system the report refers to.
The selected domain, specification group, or specification (skipped if the report refers to the overall status).
The report date and status.
The summary of conformance statement results, as counts and also percentage ratios.
Below the overview section, the report includes the listing of conformance statements presented in the same grouping as the on-screen display. Each statement includes its name and test result ratio and status.
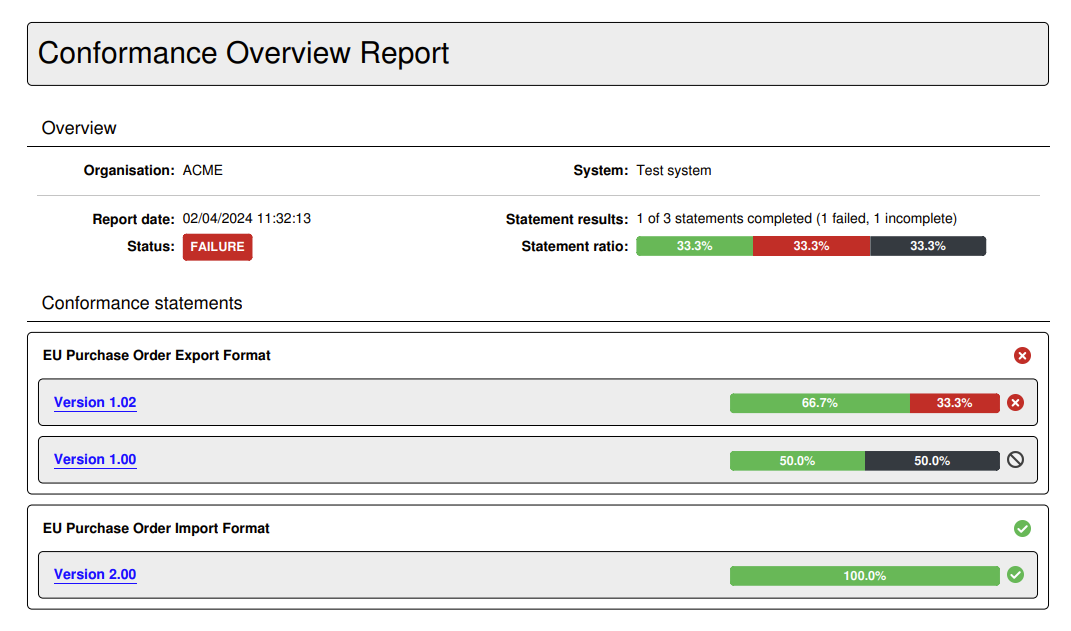
Following the summary of conformance statements, the report includes each individual statement report that lists its specific status, test suites and test cases. In fact the name of each presented conformance statement from the summary is a link you may click to access the page of the relevant statement report.
Note
Each conformance statement report included in the overview report, matches the report you can produce separately for the statement’s detail screen. When included in an overview report there are however no extended details for specific test cases.
An alternative to producing the report in PDF is to select the Download report as XML option. The format of this report is defined by the GITB Test Reporting Language (GITB TRL), and allows simpler machine-based processing. The following XML content is a sample of such a report:
<?xml version="1.0" encoding="UTF-8"?>
<ConformanceOverviewReport xmlns="http://www.gitb.com/tr/v1/"
                            xmlns:ns2="http://www.gitb.com/core/v1/"
                            xmlns:ns3="http://www.gitb.com/tbs/v1/">
   <metadata>
      <reportTime>2024-04-02T11:53:07.170+02:00</reportTime>
   </metadata>
   <overview>
      <definition>
         <party>
            <organisation>
               <name>ACME</name>
            </organisation>
            <system>
               <name>Test system</name>
               <version>v1.0</version>
               <description>A system for test purposes.</description>
            </system>
         </party>
      </definition>
      <summary>
         <status>FAILURE</status>
         <succeeded>1</succeeded>
         <failed>1</failed>
         <incomplete>1</incomplete>
      </summary>
      <statementOverview>
         <domain>
            <name>Docs domain</name>
            <description>A demo domain for documentation purposes.</description>
            <result>FAILURE</result>
            <specificationGroup>
               <name>EU Purchase Order Import Format</name>
               <description>Specification to define the data export format for EU Purchase Order Imports.</description>
               <result>SUCCESS</result>
               <specification>
                  <name>Version 2.00</name>
                  <description>Version 2.00 of the EU Purchase Order Import Format.</description>
                  <result>SUCCESS</result>
                  <actor statement="1">
                     <name>Actor</name>
                     <description>Order supplier.</description>
                     <result>SUCCESS</result>
                  </actor>
               </specification>
            </specificationGroup>
         </domain>
      </statementOverview>
      <statementDetails>
         <statement id="1">
            <definition>
               <party>
                  <organisation>
                     <name>ACME</name>
                  </organisation>
                  <system>
                     <name>Test system</name>
                     <version>v1.0</version>
                     <description>A system for test purposes.</description>
                  </system>
               </party>
               <domain>
                  <name>Docs domain</name>
                  <description>A demo domain for documentation purposes.</description>
               </domain>
               <specificationGroup>
                  <name>EU Purchase Order Import Format</name>
                  <description>Specification to define the data export format for EU Purchase Order Imports.</description>
               </specificationGroup>
               <specification>
                  <name>Version 2.00</name>
                  <description>Version 2.00 of the EU Purchase Order Import Format.</description>
               </specification>
               <actor>
                  <name>Actor</name>
                  <description>Order supplier.</description>
               </actor>
            </definition>
            <summary>
               <status>SUCCESS</status>
               <succeeded>1</succeeded>
               <failed>0</failed>
               <incomplete>0</incomplete>
            </summary>
            <lastUpdate>2023-09-28T15:52:16.000+02:00</lastUpdate>
            <testOverview>
               <testSuite>
                  <metadata>
                     <ns2:name>Simple test suite</ns2:name>
                     <ns2:version>1.0</ns2:version>
                     <ns2:description>A simple test suite.</ns2:description>
                  </metadata>
                  <result>SUCCESS</result>
                  <testCases>
                     <testCase>
                        <metadata>
                           <ns2:name>Test case 1</ns2:name>
                           <ns2:version>1.0</ns2:version>
                           <ns2:description>A simple test case.</ns2:description>
                        </metadata>
                        <result>SUCCESS</result>
                        <lastUpdate>2023-09-28T15:52:14.000+02:00</lastUpdate>
                     </testCase>
                     <testCase optional="true">
                        <metadata>
                           <ns2:name>Test case 2</ns2:name>
                           <ns2:version>1.0</ns2:version>
                           <ns2:description>Description for the second simple test case.</ns2:description>
                        </metadata>
                        <result>SUCCESS</result>
                        <lastUpdate>2023-09-28T15:52:16.000+02:00</lastUpdate>
                     </testCase>
                  </testCases>
               </testSuite>
            </testOverview>
         </statement>
      </statementDetails>
   </overview>
</ConformanceOverviewReport>
Producing a conformance overview report at the level of a specific domain, specification group or specification, is achieved using the option button presented at the right side of the statements’ display. Clicking this will present the report generation options.
The reports in either case are structured in the same way as the overall reports discussed above. The only difference is that a report at a specific aggregation level (e.g. a specification group) will also list the relevant level as part of the report’s overview information.
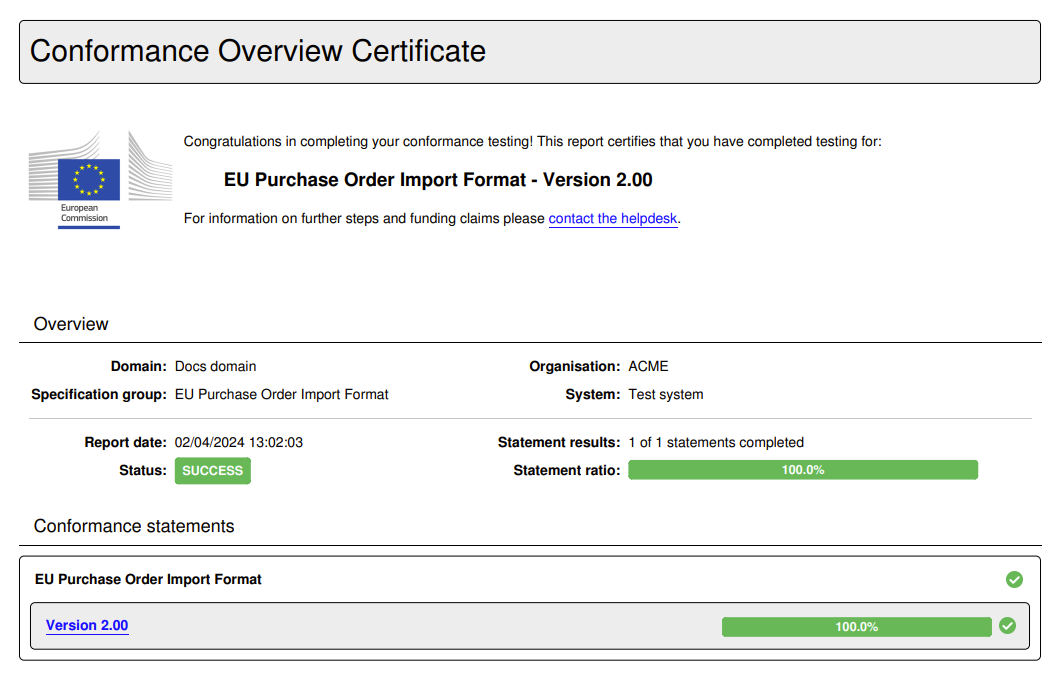
Conformance overview certificate
Depending on your community’s configuration you may also produce a conformance overview certificate. This certificate is a report (in PDF format) that attests to the fact that your current system has successfully completed testing for all relevant conformance statements. Such certificates are available for you to download if enabled by the community administrator, and if you have succeeded all relevant testing.
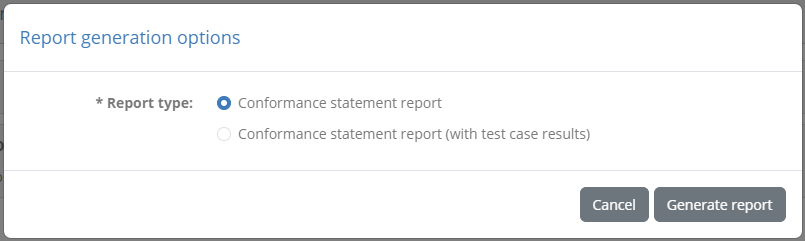
To produce a certificate you click on the PDF report generation buttons, either at the overall level or for a specific domain, specification group or specification. If generating a certificate is possible you will be prompted with a choice to select the kind of report to produce.
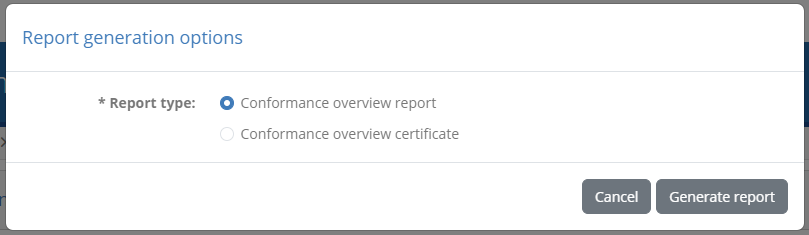
Selecting Conformance overview certificate and clicking Generate report will produce the certificate, which is similar in content to the normal overview report but is further curated by the administrator.
Note
The Conformance overview report option is the default if no certificate can be produced. In such a case clicking a PDF report download button will skip the report type prompt and directly download the overview report.
Select a conformance snapshot
Note
Viewing and selecting a conformance snapshot is possible when viewing your community’s organisations. Snapshots are not applicable to your “Admin organisation” as it is never included in snapshots.
A conformance snapshot represents a milestone in the conformance testing process that can be made by a community administrator. It is called a snapshot as it is a readonly copy of the conformance testing status at a given point in time, that captures the defined specifications, organisations and test results at that moment. If such snapshots are available you will see the header on this screen display an additional control to select which conformance testing status you want to view. By default you always view the latest conformance status.
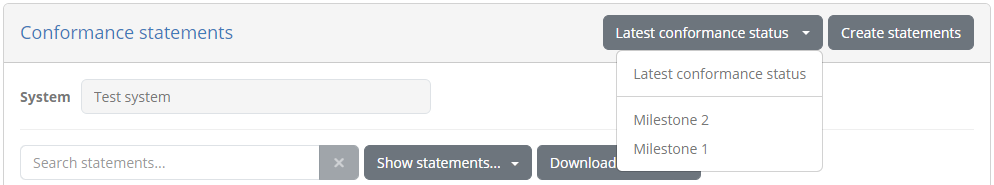
Selecting a specific snapshot, or switching back to the latest status, will refresh the screen to present the relevant conformance statements. Note that a snapshot could also include elements such as specifications and systems that were defined at the time the snapshot was taken, but that may have since been modified or ever deleted. All controls here otherwise remain the same with the exception of not being able to define new conformance statements while a snapshot is selected.
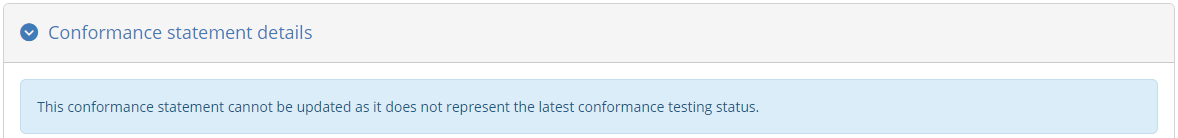
In addition, when viewing a specific snapshot and selecting to view a statement’s details you will notice that the statement is presented as readonly, meaning that is cannot be deleted or have new test executions. In addition, you will see a message informing you that this statement does not represent the latest testing status.
View a conformance statement’s details
The conformance statement detail screen provides you the test status summary for a given system of your organisation and a specification’s actor. In addition it is the point from which you can start new tests. The information displayed in this page is organised in three sections to present to you:
The details of the conformance statement.
The configuration for your system, used when it is defined as a test case’s SUT.
The status and controls of the related tests.
Overview
The Conformance statement details section provides you the context of what your system is supposed to conform to.
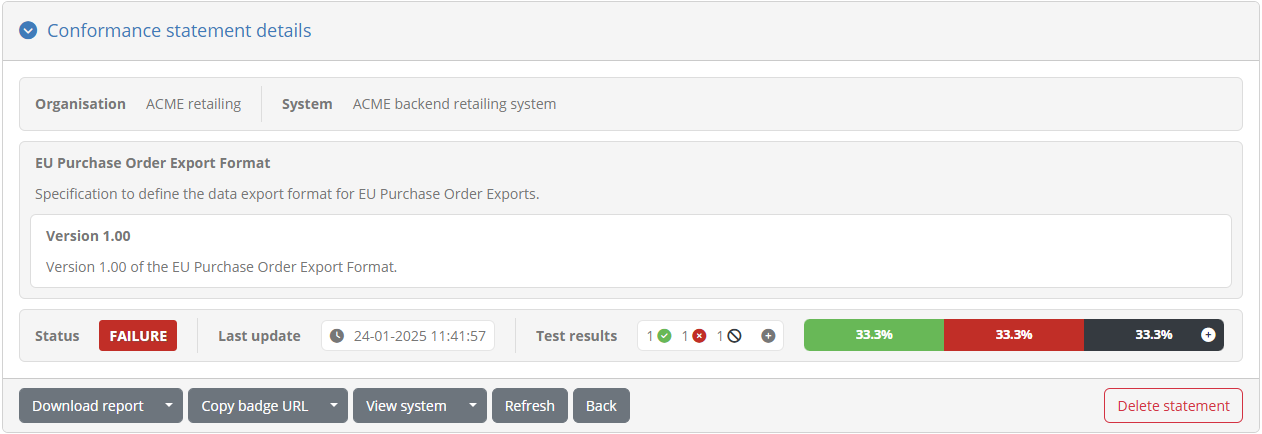
The panel’s header displays the overall conformance status based on the latest test results (success, failure or incomplete). Within the detail panel you see at the top the name of the organisation and system for which this conformance statement has been made. Following this you see the name and description of the specification you are claiming conformance for, including any options (e.g. specification versions, profiles or roles) that apply. Finally, at the bottom of the panel you see status information, specifically:
The last update time, corresponding to the last time the status of the conformance statement was updated.
The result counts, showing the number of tests in the conformance statement that are completed, failed or incomplete.
The result ratios, illustrating the same results but as a percentage of the total tests in the statement.
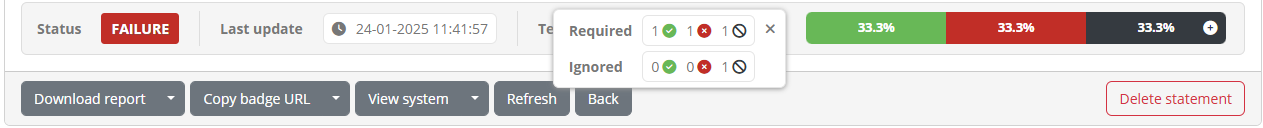
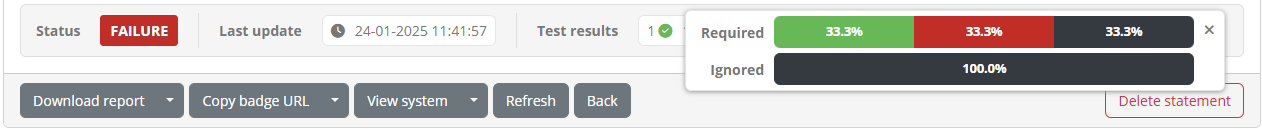
Similar to the conformance statements’ listing, in case your statement includes optional test cases, the counts and ratios will display a plus button that can be clicked to expand and display both mandatory and optional tests. Note that optional and disabled tests do not count towards your conformance status.
At the bottom of the details’ panel you are presented with buttons for further actions as follows:
The Download report button to export your system’s current conformance statement report in PDF or XML, or download a conformance certificate.
The Copy badge URL and Preview badge buttons to copy (or preview) a conformance badge for your current status. This is available only if you have configured such badges.
The View system button navigates to the statement’s related system. Through the additional options you can also navigate to the related organisation, community, actor, specification and domain.
The Refresh button allows you to refresh the status of your conformance statement to view its latest results.
The Back button to return to the conformance statement list.
The Delete statement button to delete the conformance statement.
The overall detail panel can be collapsed and expanded by clicking its header. When collapsed, the panel’s title is replaced by the specification’s name, and controls are displayed next to the statement’s status.

Collapsing the details could be useful if you would want to focus on the tests to execute rather than the statement’s details. If you do so, this choice will be recorded as part of your user preferences, applying it automatically whenever you visit a statement’s details.
Beneath the statement details’ panel you are presented with two tabs that allow you to interact and manage the conformance statement:
The Conformance tests tab to view and launch the statement’s tests.
The Configuration parameters tab to view and edit the statement’s configuration if needed.
Using conformance badges
Conformance badges are an optional feature for specifications that may be set up for your community. Badges are images that indicate a specific live status for a given organisation’s system, with respect to a specific conformance statement. They are meant to be accessible publicly so that they can be embedded in displays such as online dashboards or GitHub README files.
In case conformance badges are configured for the statement’s specification, the detail panel’s controls will also include a Copy badge URL button.

Clicking this will copy to your clipboard a URL that you can then refer to from outside the Test Bed to display a badge. A typical use case for this would be to add it as the source of an image in a HTML page listing conformant solutions. The same button also includes a secondary option named Preview badge that you can click for a preview.
Note that the displayed badge is dynamically updated to always reflect the latest conformance testing status. For example if new test cases are added to the statement, accessing the same badge (displayed as a “success” badge above) will switch to an “incomplete” badge.
Note
By default conformance badges illustrate a “success” and “not success” state. It could be the case however that specific “failure” badges are also configured depending on your community’s setup.
Conformance tests
The Conformance tests tab lists the tests linked to the conformance statement. These are the tests that you need to successfully complete to be considered as conformant. The display includes two parts:
A set of controls to filter the displayed test cases and configure test execution.
The list of test cases included in the conformance statement.
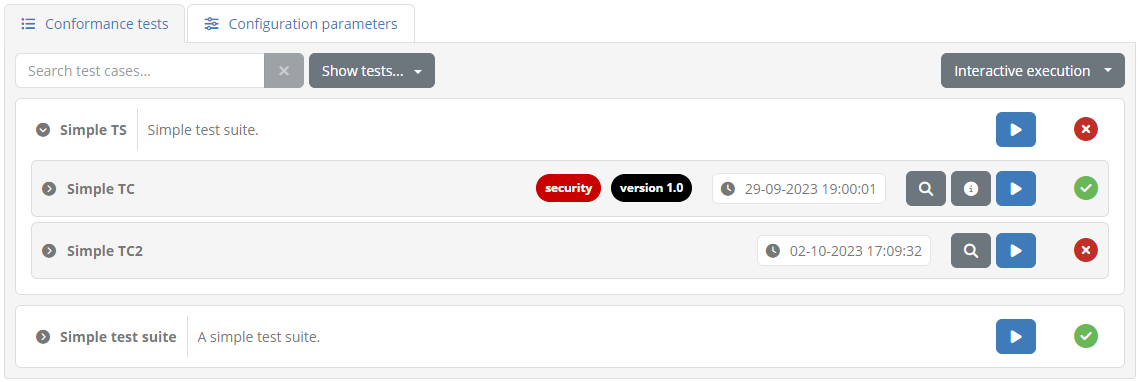
The statement’s test cases are grouped by their test suite, of which the name is presented in bold, alongside its description. This test suite header can be clicked to expand or collapse the displayed test cases, which could be interesting if there are multiple test suites. Note that if only a single test suite is defined it appears as expanded by default.
Each test suite includes within it the listing of its test cases. The information displayed for each test case includes:
An icon indicating of whether it is required, optional, or disabled. Note that if only required tests are defined this icon is hidden.
Its name, a short text to identify and refer to the test case.
Zero or more tags that highlight specific traits relevant to the test case. These can also be hovered over to view further information.
The date and time of the test case’s last execution.
The status of the latest test session executed for the test case (displayed on the right).
The test case extended description, which is initially hidden but can be displayed if clicking on the test case row.
This information is complemented by the test case controls which depending on the status of the test case include:
An option button, if a test session has been executed, that allows you to view the latest and prior executed sessions in the test session history, download its test report in PDF or XML format, and download the test session’s data.
An information button to view the test case’s extended documentation (if defined).
A play button to start a new test session for this test case.
When selecting to download the test session’s data, you will download a ZIP archive that includes:
The test case report in XML format, extended to include the data of individual test steps.
A data folder including files, each named using a unique identifier.
The files in the data folder correspond to step data that is binary or too large to include directly in the XML report.
Where such files are present, their identifiers are referenced in the XML report in place of their value. In the following
example, identifier c889a5ca-466d-4c3e-81b3-7f2174ef2d2e refers to the name of a large text file that can be found in
the data folder.
...
<step id="1">
    <context type="map">
        ...
        <ns2:item name="body" embeddingMethod="BASE64" type="binary" mimeType="text/plain">
            <ns2:value>___[[c889a5ca-466d-4c3e-81b3-7f2174ef2d2e]]___</ns2:value>
        </ns2:item>
    </context>
<step>
...
At the level of the test suite you can also view the aggregated status of the test suite’s test cases, as well as additional controls:
An information button to view the test suite’s extended documentation (if defined).
A play button to launch test sessions for all listed test cases. This will be missing if the test suite contains only a single test case.
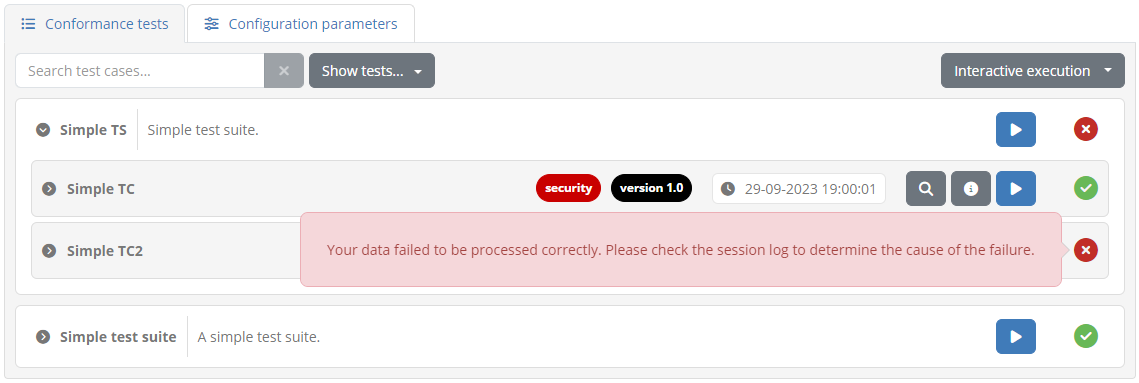
When test sessions are completed for the statement’s different test cases, the displayed status will be adapted to present them as successful or failed. Moreover, in case a test session also produced a detailed output message, this can be viewed by clicking on the success or failure icon.
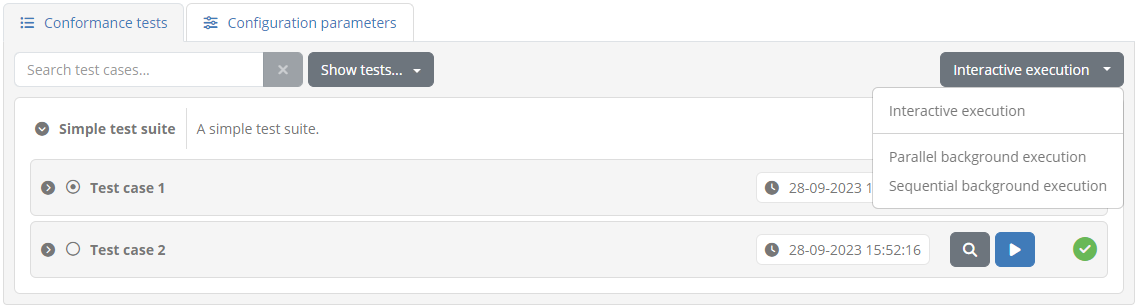
Above the display of test suites the Conformance tests tab includes controls relevant to test case selection and execution.

On the left side you are presented with controls to filter the displayed test cases. In case there are multiple test suites defined, the show test suite control allows you to lookup and select a specific one. Next to this you can find a dropdown menu that defines which tests are displayed based on their status. You may choose to show all tests (the default), or select successful tests, failed tests or incomplete tests. If there are also optional and disabled test cases you may also select (or deselect) their display from here as well. Finally, at the end of the filtering controls is also a search box that you can use to filter, in a case-insensitive manner, the displayed test cases based on their name or description.
Any change to filtering options will update the display to list the matched test cases. It is important to note that when selecting to run test cases at the level of the displayed test suite or the overall conformance statement, the test cases to be executed will be those that match the current filtering options.
Note
Disabled test cases can be reviewed in case they have previous test results, but they are hidden by default and cannot be executed.
To the right side you may find a further dropdown menu that determines how test cases will be executed, as well as a button to launch all tests matching the current filtering criteria. This button will be missing in case only a single test suite is displayed.
Regarding the test execution approach, the options available are the following:
Interactive execution, to launch tests in an interactive manner, presenting their test execution diagram and interacting with you for inputs.
Parallel background execution, to launch tests in the background executing them in parallel. Note that test cases that don’t support parallel execution will be ran sequentially.
Sequential background execution, to launch tests in the background executing them one by one in sequence.
Opting for background execution allows you to launch a potentially large number of test sessions without needing to oversee their progress. Note however that test cases foreseeing user interactions will proceed depending on the test case definition. Specifically:
Instructions are simply skipped, assuming that these are purely of informational value.
Inputs may either cause the test session to pause for later completion, or be automatically handled. Automatic handling involves either skipping the inputs, or delegating their collection to a supporting service (if one is configured in the test definition). Note that skipping expected user inputs due to background test execution will most likely result in failed test sessions, unless the test cases are designed to handle missing values.
The status of test sessions launched in the background can be monitored by means of the test history screen. From here you may also complete pending user interactions if doing so is foreseen in the relevant test case definitions.
Finally, recall that the listed test suites and test cases may include an information button in case they define extended documentation. This documentation complements the displayed description with further information such as diagrams and reference links.
Clicking this button results in a popup window containing the extended documentation.
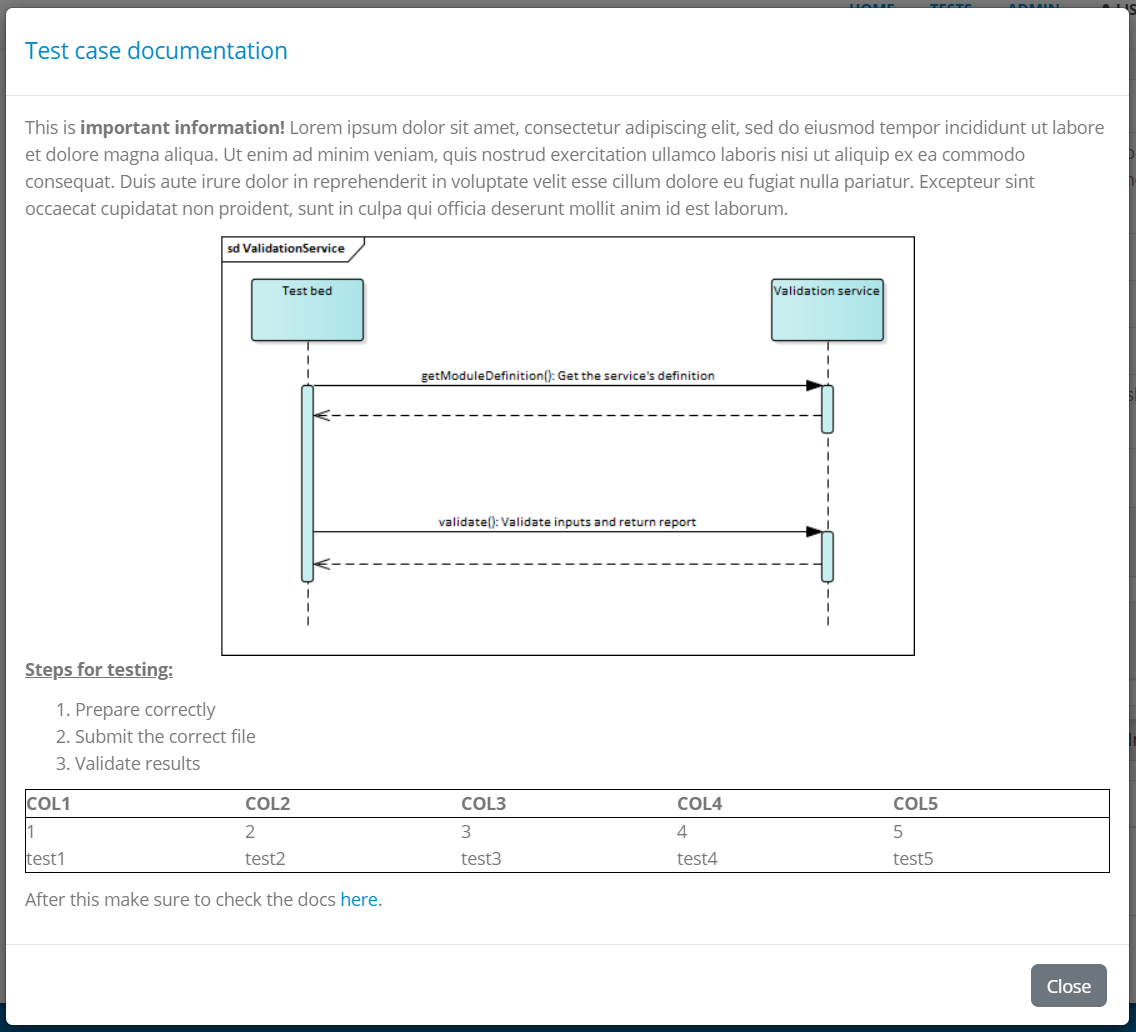
Note that the documentation on test cases is also available to consult during their execution (in case of interactive execution).
Configuration parameters
Alongside the Conformance tests tab you are presented with the Configuration parameters tab. This includes configuration for the specific conformance statement that you are expected to provide, as well as your organisation and selected system.
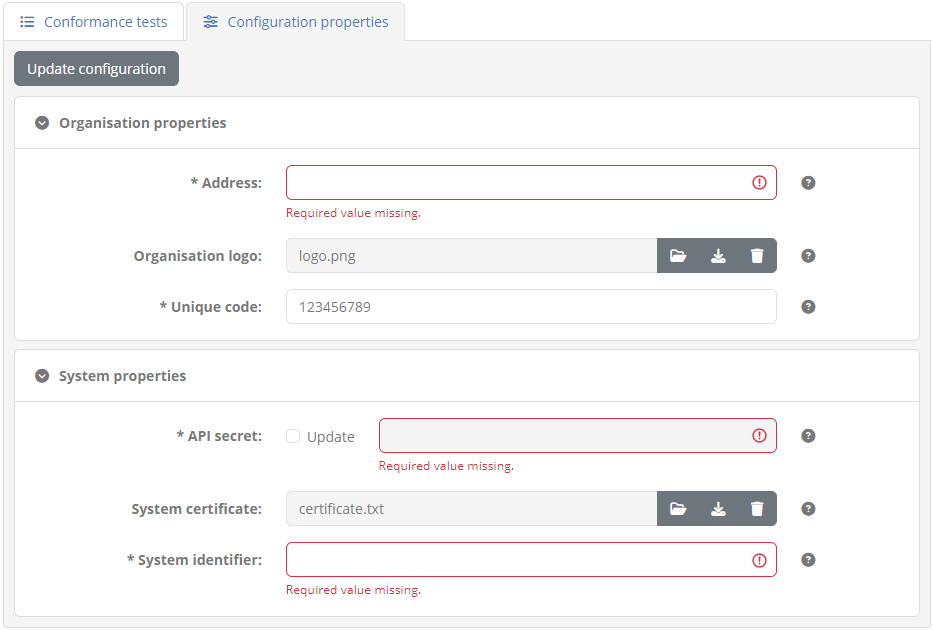
Configuration properties are displayed in panels grouping together organisation properties, system properties and statement properties. For each property you see its name, value and a tooltip with a description, including an asterisk if a value is required before executing tests.
How you view and edit the value of each property depends on its type, and can be either a text field, password field or file upload control. To update the properties’ values make the desired changes and click on Update configuration. Doing so will save the latest values and validate once again whether you can proceed with executing tests.
Export conformance statement report
The conformance statement report provides the details on the conformance statement and also an overview of its relevant tests. To generate it click the Download report button from the overview section’s panel.
Once the button is clicked you will be prompted for the level of detail you want to include in the report. Two options are available regarding whether or not you want to include each test case’s step results in the report.
Selecting Conformance statement report (with test case results) includes the conformance statement details and test overview but also each test case’s step results. Selecting Conformance statement report on the other hand skips the test step results.
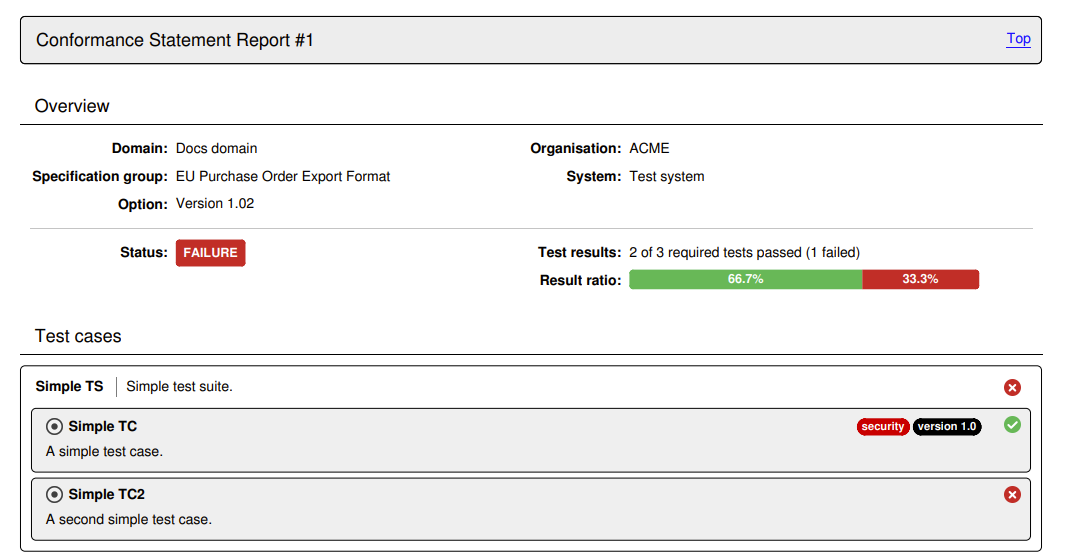
The following sample illustrates the information that is included in the report’s overview section that is always included. Specifically:
The information on the domain, specification and actor for the selected system.
The name of the system’s organisation and the system itself.
The date the report was produced.
The overall conformance status, the number of successfully passed test cases versus the total as well as result percentage ratios.
A listing of the statement’s test suites, each including its test cases and their result. Test cases are presented as a link to take you directly to the relevant result (if test steps were selected to be included).
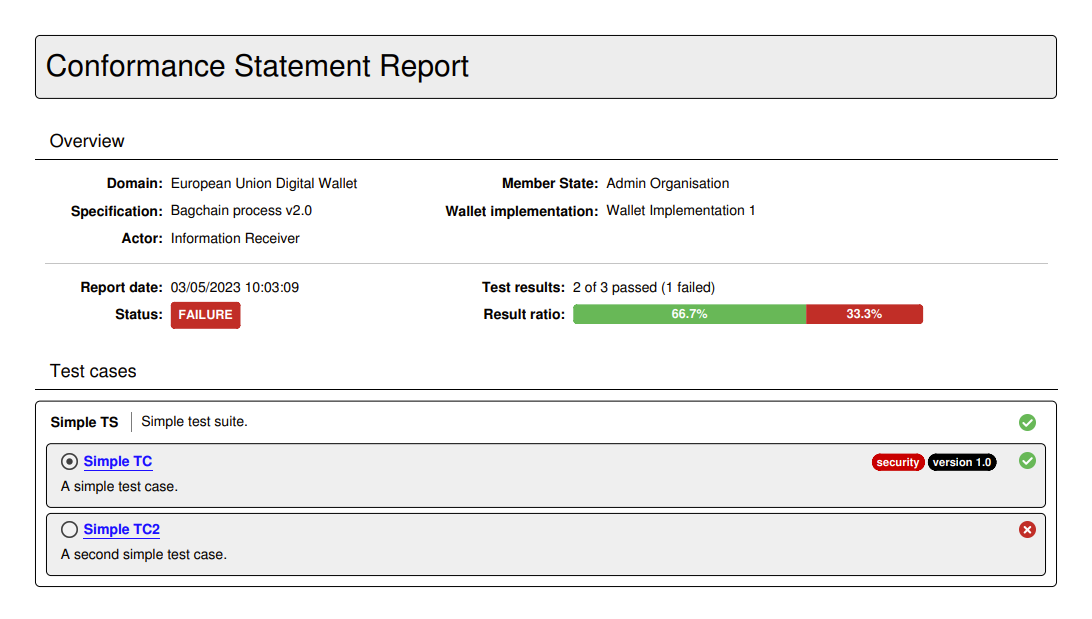
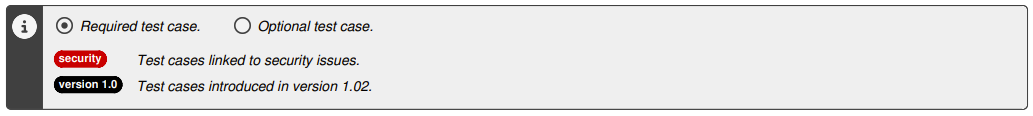
If the listed test cases include optional or disabled test cases, or if any of them define tags, the listing of test cases is followed by a legend explaining the meaning of the different status icons and tags.
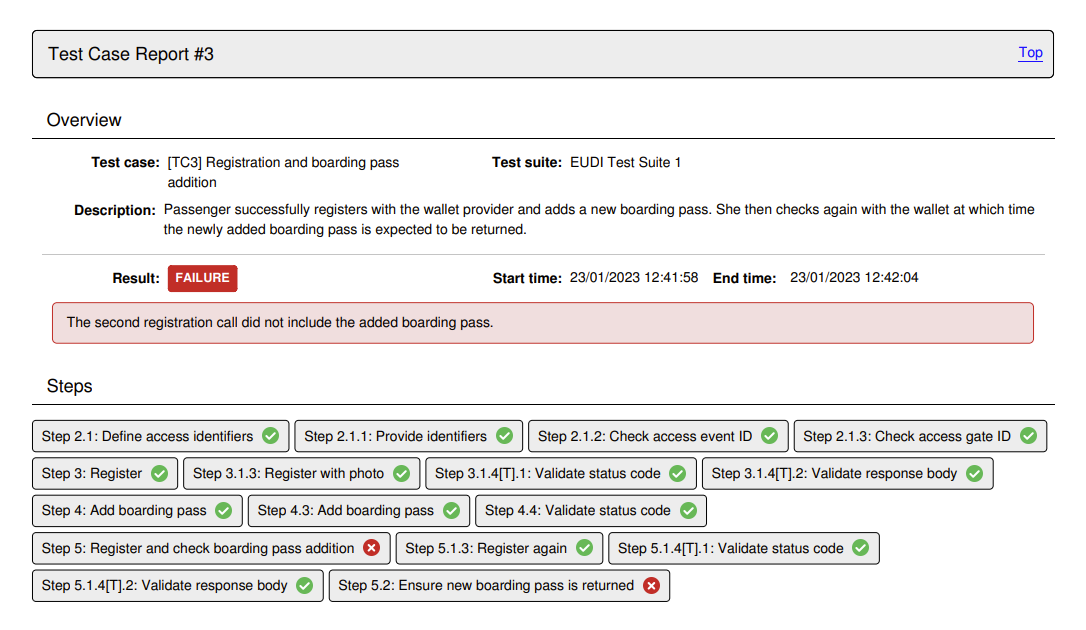
In case the option to add each test case’s step results is selected, the report includes a page per test case displaying its summary and the result of each test step. The test case’s title includes its reference number listed in the report’s overview section, and provides also a link to return to the listing of test cases.
Note
Detailed report size: The detailed conformance statement report presents each test session and individual step in a separate page. If your conformance statement contains numerous test cases, each with multiple test steps, the resulting detailed report could be quite long.
An alternative to producing the report in PDF is to select the Download report as XML option presented by clicking to expand the download button’s options. The format of this report is defined by the GITB Test Reporting Language (GITB TRL), and allows simpler machine-based processing. As in the case of the PDF report, you are prompted whether or not to include detailed test step results before proceeding with the download. The following XML content is a sample of such a report:
<?xml version="1.0" encoding="UTF-8"?>
<ConformanceStatementReport xmlns="http://www.gitb.com/tr/v1/"
                             xmlns:ns2="http://www.gitb.com/core/v1/"
                             xmlns:ns3="http://www.gitb.com/tbs/v1/">
   <metadata>
      <reportTime>2024-04-02T14:13:18.267+02:00</reportTime>
   </metadata>
   <statement>
      <definition>
         <party>
            <organisation>
               <name>ACME</name>
            </organisation>
            <system>
               <name>Test system</name>
               <version>v1.0</version>
               <description>A system for test purposes.</description>
            </system>
         </party>
         <domain>
            <name>Docs domain</name>
            <description>A demo domain for documentation purposes.</description>
         </domain>
         <specificationGroup>
            <name>EU Purchase Order Export Format</name>
            <description>Specification to define the data export format for EU Purchase Order Exports.</description>
         </specificationGroup>
         <specification>
            <name>Version 1.02</name>
            <description>Version 1.02 of the EU Purchase Order Export Format.</description>
         </specification>
         <actor>
            <name>Actor</name>
            <description>Order supplier.</description>
         </actor>
      </definition>
      <summary>
         <status>FAILURE</status>
         <succeeded>2</succeeded>
         <failed>1</failed>
         <incomplete>0</incomplete>
      </summary>
      <lastUpdate>2023-09-29T19:00:01.000+02:00</lastUpdate>
      <testOverview>
         <testSuite>
            <metadata>
               <ns2:name>Simple TS</ns2:name>
               <ns2:version>0.1</ns2:version>
               <ns2:description>Simple test suite.</ns2:description>
            </metadata>
            <result>FAILURE</result>
            <testCases>
               <testCase>
                  <metadata>
                     <ns2:name>Simple TC</ns2:name>
                     <ns2:version>1.0</ns2:version>
                     <ns2:description>A simple test case.</ns2:description>
                     <ns2:tags>
                        <ns2:tag name="security" foreground="#ffffff" background="#d20000">Test cases linked to security issues.</ns2:tag>
                        <ns2:tag name="version 1.0" foreground="#ffffff" background="#000000">Test cases introduced in version 1.02.</ns2:tag>
                     </ns2:tags>
                  </metadata>
                  <result>SUCCESS</result>
                  <lastUpdate>2023-09-29T19:00:01.000+02:00</lastUpdate>
               </testCase>
               <testCase>
                  <metadata>
                     <ns2:name>Simple TC2</ns2:name>
                     <ns2:version>1.0</ns2:version>
                     <ns2:description>A second simple test case.</ns2:description>
                  </metadata>
                  <result>FAILURE</result>
                  <lastUpdate>2023-10-02T17:09:32.000+02:00</lastUpdate>
               </testCase>
            </testCases>
         </testSuite>
         <testSuite>
            <metadata>
               <ns2:name>Simple test suite</ns2:name>
               <ns2:version>1.0</ns2:version>
               <ns2:description>A simple test suite.</ns2:description>
            </metadata>
            <result>SUCCESS</result>
            <testCases>
               <testCase>
                  <metadata>
                     <ns2:name>Test case 1</ns2:name>
                     <ns2:version>1.0</ns2:version>
                     <ns2:description>A simple test case.</ns2:description>
                  </metadata>
                  <result>SUCCESS</result>
                  <lastUpdate>2023-09-28T15:52:14.000+02:00</lastUpdate>
               </testCase>
               <testCase optional="true">
                  <metadata>
                     <ns2:name>Test case 2</ns2:name>
                     <ns2:version>1.0</ns2:version>
                     <ns2:description>Description for the second simple test case.</ns2:description>
                  </metadata>
                  <result>SUCCESS</result>
                  <lastUpdate>2023-09-28T15:52:16.000+02:00</lastUpdate>
               </testCase>
            </testCases>
         </testSuite>
      </testOverview>
   </statement>
</ConformanceStatementReport>
Export conformance certificate
The conformance certificate is a report (in PDF format) that attests to the fact that your current system has successfully passed its expected test cases. The option to generate this is only visible if your system has succeeded in all configured tests.
Assuming the option is available for you, you can select the Download conformance certificate option after having expanded the download button’s options. The certificate will typically resemble the following sample:
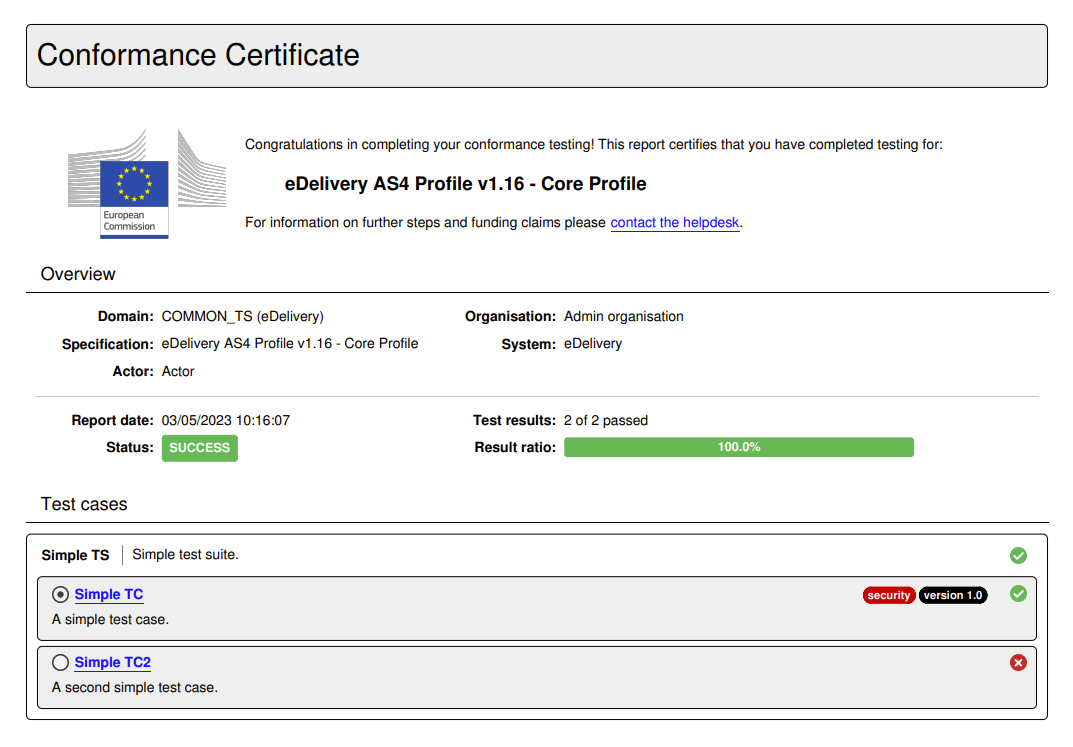
The contents of the certificate are defined by your administrator and are a customisation of the conformance statement report. The certificate may omit certain sections, include a message for you, and potentially be digitally signed.
Delete conformance statement
Deleting the conformance statement may be desired if you created it by mistake or if your system is no longer expected to conform to the given specification. Deleting the conformance statement is possible through the Delete statement button from the overview panel.
Clicking this will request confirmation and, if confirmed, will remove the conformance statement. Note that your testing history relevant to this conformance statement still remains and can be consulted through your test history. In addition, if you create the same conformance statement again, your previous tests will be once again counted towards your conformance testing status.
Execute tests
Executing conformance tests is the reason your community is using the Test Bed. Considering that test cases are linked to your system by means of conformance statements, the first step before executing a test is to visit a conformance statement’s detail screen. This screen is the place where you input required configuration and are provided with the controls to execute one or more tests.
Provide your system’s configuration
The testing configuration for your selected specification may require that you provide one or more configuration parameters before executing tests. If for example test cases require that the Test Bed sends messages to your system, it is likely that you need to inform the Test Bed on how to do so.
Providing and reviewing the configuration for your system is done through the Configuration parameters tab of the conformance statement detail page. In addition, you may need to provide inputs for mandatory organisation-level and system-level properties that apply to your organisation.
Once all required configuration is provided you can choose to execute one or more test cases through the conformance statement details’ Conformance tests tab. The test execution process starts by clicking one of the available Play buttons. In short, you can either execute a specific test case or a complete test suite and choose whether the test sessions will be launched in the background or in interactive mode (the default). Furthermore, for background test sessions you may choose whether these will be executed in parallel or sequentially.
Regardless of how test sessions are to be launched, if required configuration is missing you will be presented with a popup listing the missing information, split per type:
Organisation properties: Properties at the level of the whole organisation.
System properties: Properties at the level of the system being tested.
Conformance statement parameters: Configuration parameters linked to the specific conformance statement.
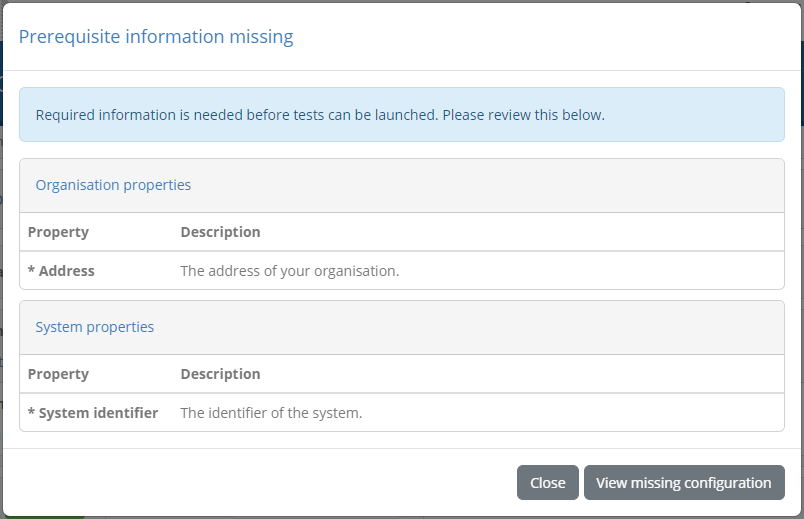
In each case you see the name and description of the missing property. Clicking Close will close the popup, whereas clicking View missing configuration will take you to the Configuration parameters tab.
Background execution
Launching tests in the background is done by selecting one of the background execution options from the Conformance tests tab (“parallel” or “sequential”).
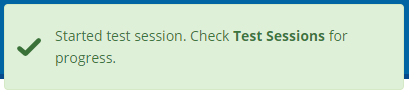
With this set you click the Play button to launch all tests, a full test suite, a specific test case, or a currently filtered set of test cases. Doing so will launch the test sessions in the background presenting a brief visual confirmation in the top right area of the screen.
The status of test sessions launched in the background can be monitored by means of the test history screen.
Interactive execution
Launching tests interactively is the default option and is enabled by setting the execution mode dropdown menu to Interactive execution.
With this set you click the Play button to launch all tests, a full test suite, a specific test case, or a currently filtered set of test cases. Doing so will display the list of test cases you have selected for execution:
The presented display includes on top a set of controls to manage your tests and control their execution. Specifically:
The Go to conformance statement button allows you to return at any time to the conformance statement detail screen. In case you click this when test sessions have already started executing they will continue to run in the background.
Through the Options button you can adapt the way test sessions are displayed. By default completed tests are hidden and pending tests are displayed to have the active session always on top. You can however adapt these settings to e.g. view an already executed test or hide upcoming ones.
Similarly through the Options button you can select how execution continues once a test session completes. By default the next test session will start automatically but you can choose to have execution pause whenever a test completes.
Note
Executing a single test case: In case you have chosen to execute only a single test case the options managing the display of test sessions and the execution of further test cases are not presented.
Beneath these controls, you can see the list of test cases to execute. For each test case you can see its name, description as well as its current status (ready, ongoing, failed or succeeded). In case the test case has extended documentation, an additional information button is presented that can be clicked to present it in a popup:
For the currently active test case you see an additional panel that presents to you the test diagram, the test counter (if executing multiple test cases) and the test session identifier (which can be clicked to copy). The View log button on the right can be used to view and follow the test session’s log (see View test session log).
Once all configuration has been prepared and the current test case’s definition has been loaded you will be able to proceed with the test execution. You can do this by clicking the Start button from the test execution controls.

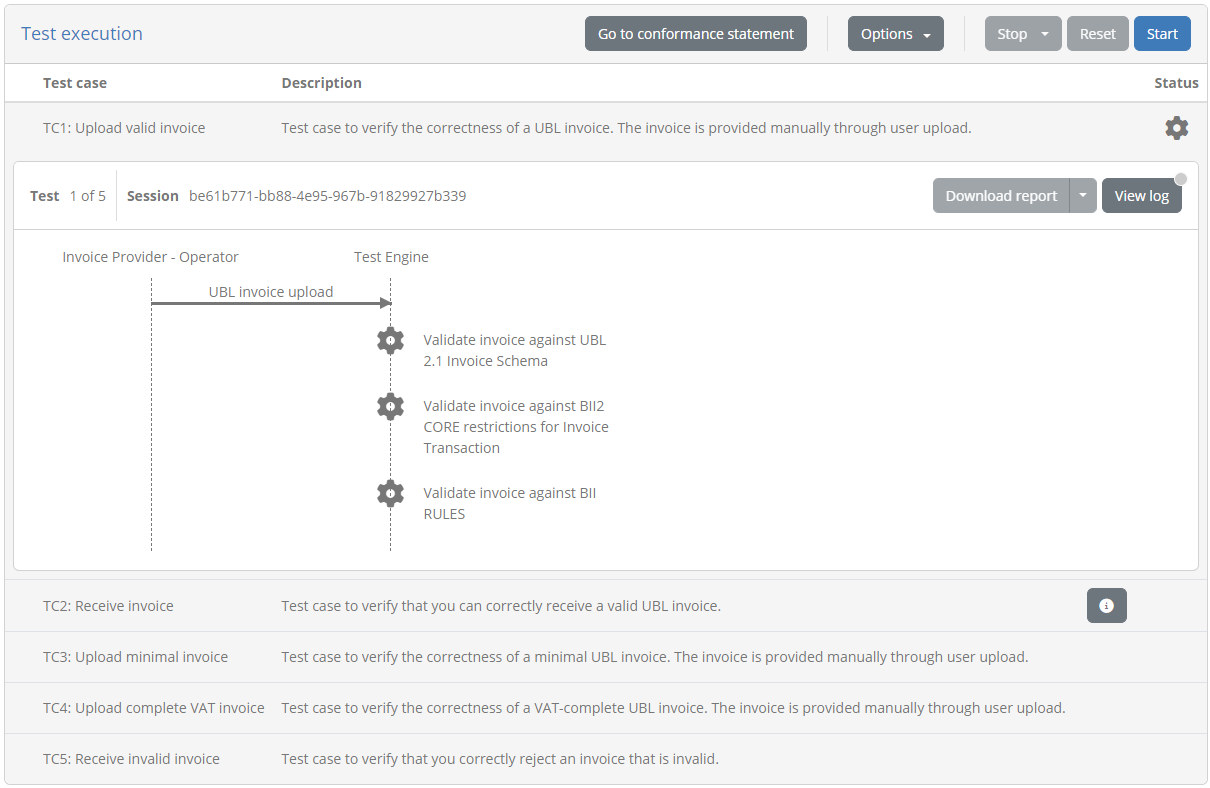
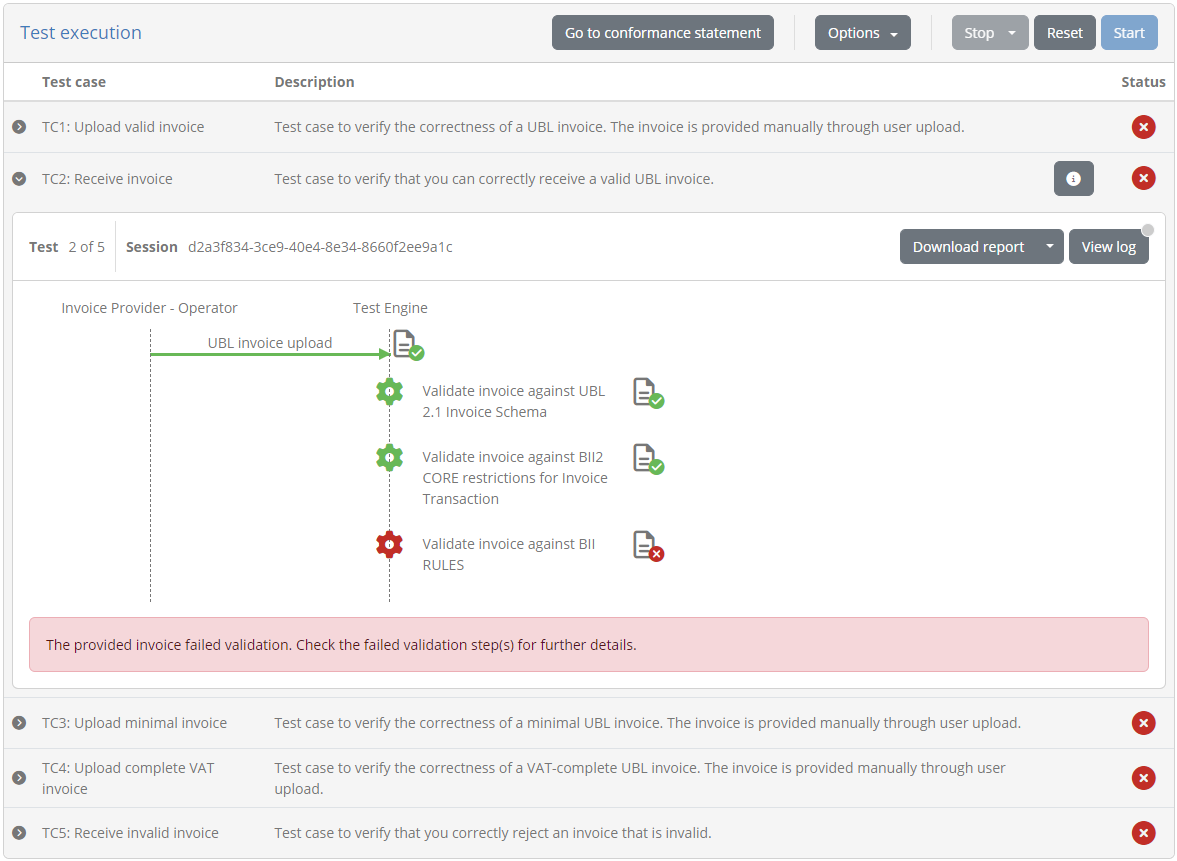
Test execution
To start executing your selected tests click the Start button from the test execution controls.
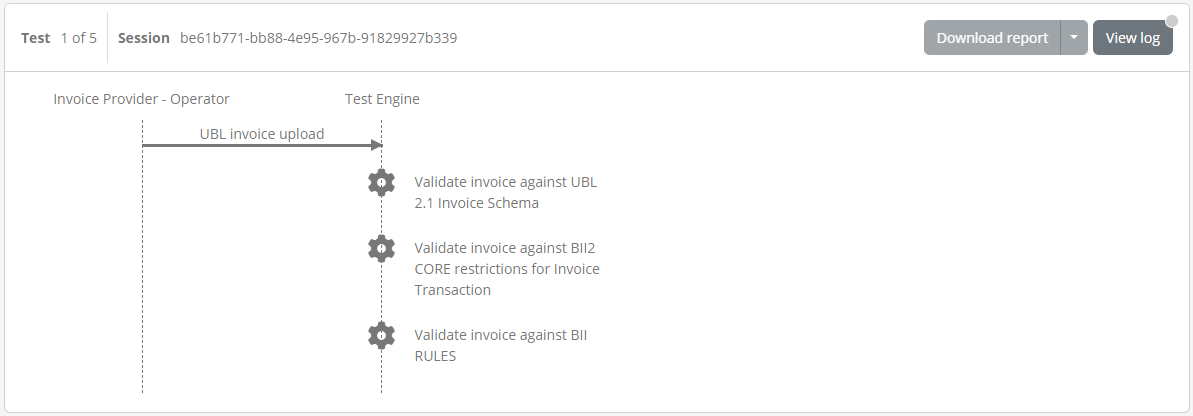
Test execution goes through the steps defined in the test case’s definition which are presented in a way similar to a sequence diagram. The elements included in this diagram are:
A lifeline per actor defined in the test case. One of these will be marked as the “SUT” (the System Under Test), whereas the other actor lifelines will be simulated. An additional user lifeline may also be present in case user interaction is defined in the test case.
Expected messages between actors represented as labelled arrows indicating the type and direction of the communication.
A Test Engine lifeline in case the test case includes validation or processing steps that are carried out by the test bed that don’t relate to a specific actor.
Zero or more cog icons, typically under the “Test Engine” indicating the points where validation or processing will take place.
Visual grouping elements that serve to facilitate the display in case of e.g. conditional steps, parallel steps or loops.
Monitor and manage test progress
Clicking the Start button begins the first selected test case’s session. What follows depends on the definition of the test case as illustrated in the presented diagram but can be summarised in the following types of feedback:
Exchanges of messages between actors (i.e. the displayed arrows) proceed. Messaging initiated by the Test Bed happens automatically, whereas for messages originating from your system the test session blocks until you trigger them, e.g. through your system’s user interface.
Popup dialogs relative to interaction steps are presented to either inform you or request input.
Validation or processing steps take place automatically.
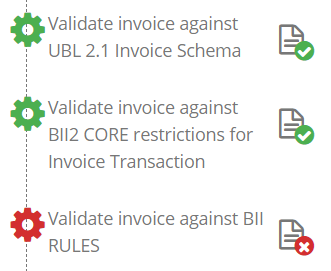
During the execution of the test case, colours are used to inform you of each step’s status:
Blue is used to highlight the currently active or pending step. This could be a blue arrow showing that a message is expected or a spinning blue cog to show active processing.
Grey is used for all elements that haven’t started yet or that have been skipped (e.g. due to conditional logic). Skipped steps are also displayed with a strike-through to enhance the fact they have been skipped.
Green is used for steps that have successfully completed.
Red is used for steps that have failed with a severity level of “error”.
Orange is used for steps that have failed with a severity level of “warning”.
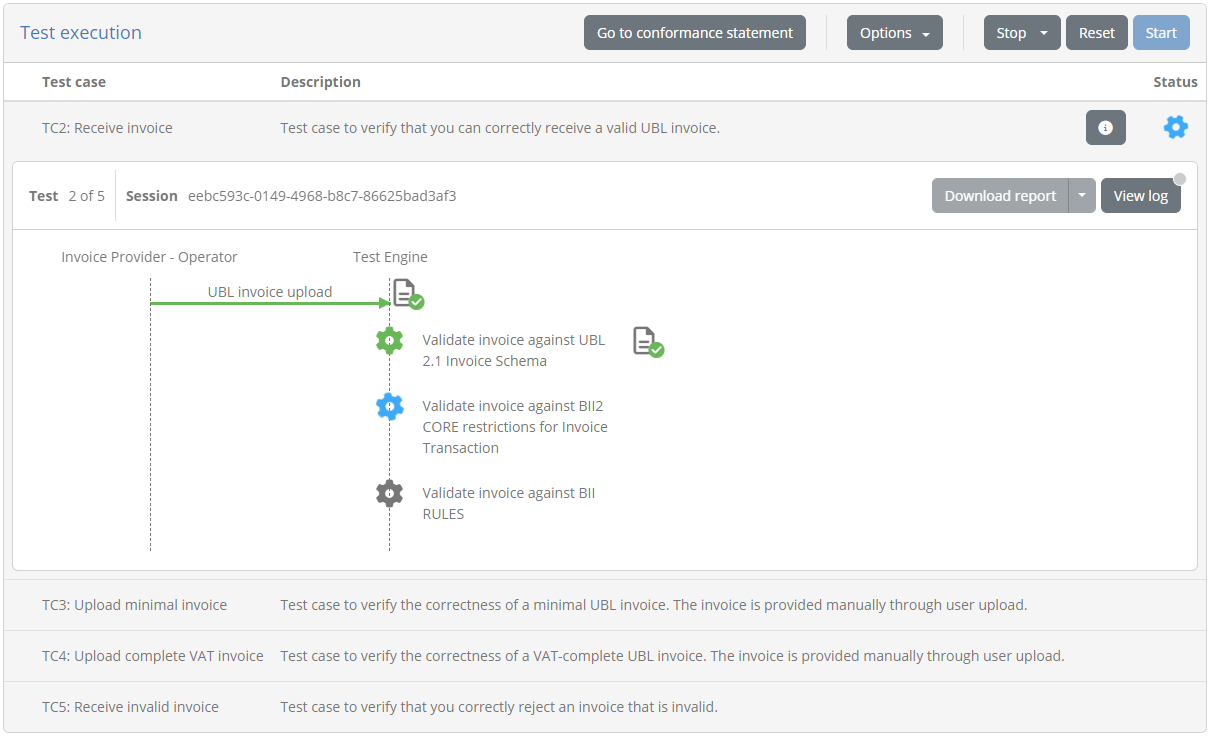
The colour-based feedback is also repeated at the level of the test case overview in the status cog icons. The icon’s colour serves to highlight the currently active test case, versus future ones or completed ones (in case these are displayed). Once completed, the status icon for the test case is replaced by a green tick or red cross to indicate the session’s overall result as a success or failure respectively. Note that a test session is considered as failed if it contains at least one error; warnings are displayed but don’t affect the overall test outcome (i.e. in the presence of warnings and no errors the overall test result will be successful).
During a test you may be prompted with certain information or be requested for inputs. When this occurs you will see a user interaction popup with information and inputs depending on the specific test step.
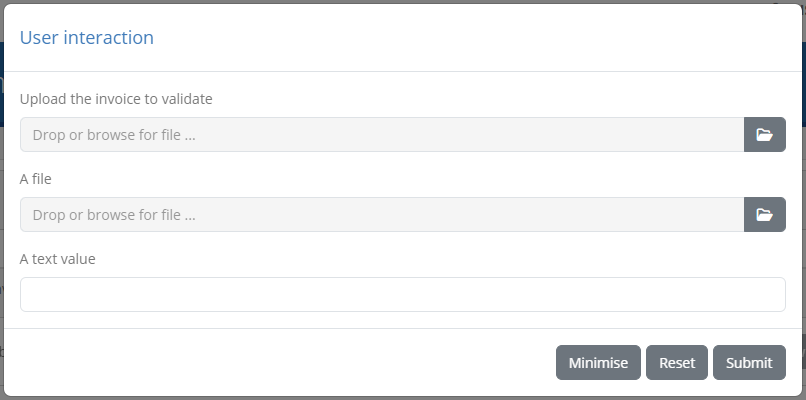
Such prompts allow you to inspect the information provided (for example a simple text value, a file, an image) with controls to copy, open in an editor, preview or download as applicable. Input controls on the other hand vary depending on the information requested, ranging from file upload and text inputs to code editors. Information-only pop-ups can be closed, whereas when inputs are requested you are able to reset and submit your data. In addition, you may minimise the prompt to inspect other information such as previous test step reports. If user prompts are minimised you will see a a View pending interaction button, that can be clicked to restore the popup.

Note
User interactions can also be completed asynchronously by inspecting your currently active test sessions.
In case multiple test cases are up for execution, testing proceeds automatically unless you have chosen to continue manually. In such a case you will need to click againt the Start button to proceed. Stopping the test(s) execution is achieved by clicking the Stop button from the test execution controls. In case you are executing multiple test cases this offers two options, stopping only the current test or all test cases.
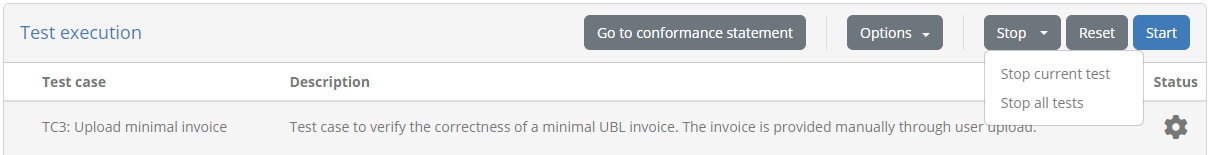
During test case execution (or when tests are no longer running) the Reset button will also be enabled. This serves as shortcut to stop any ongoing tests and re-run them.
View test step documentation
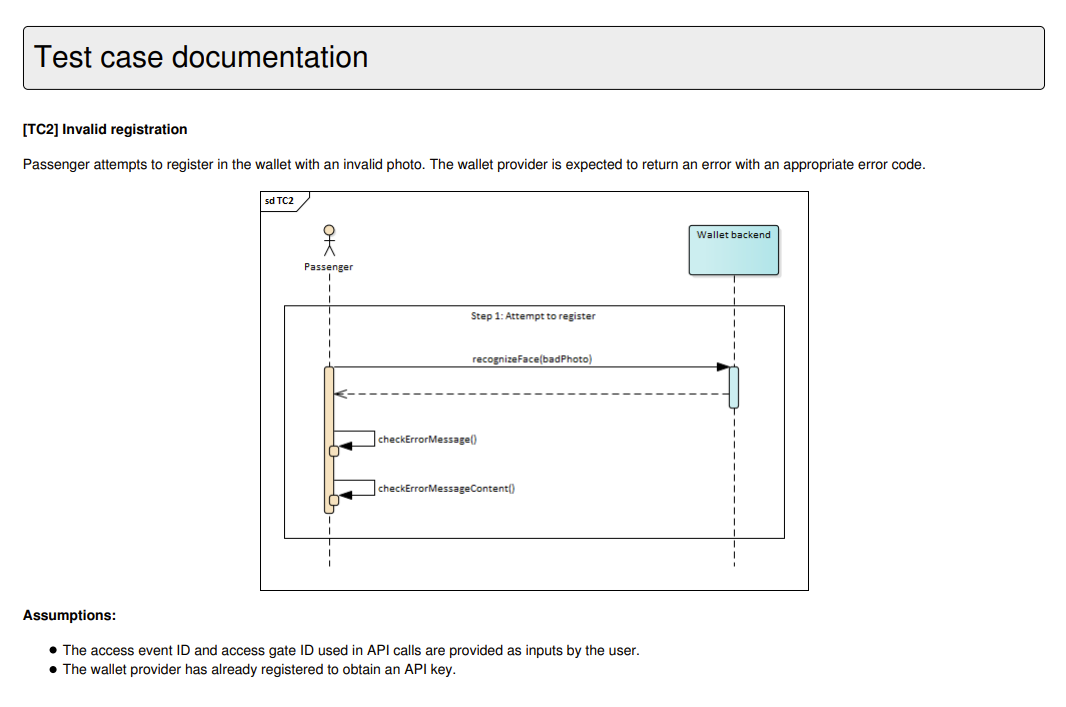
Test steps are presented in the test execution diagram with a limited description label. Test steps can however be defined to also include additional detailed context, documentation, or instructions. Test steps defining such additional documentation are presented with a circled question mark next to their label that can be clicked.
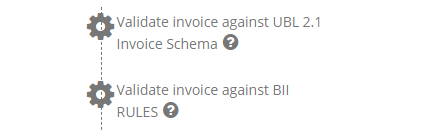
Clicking the presented icon results in a “Step information” popup that displays the further documentation linked to the step. This can range from being a simple text to rich text documentation, including styled content, tables, lists, links and images.
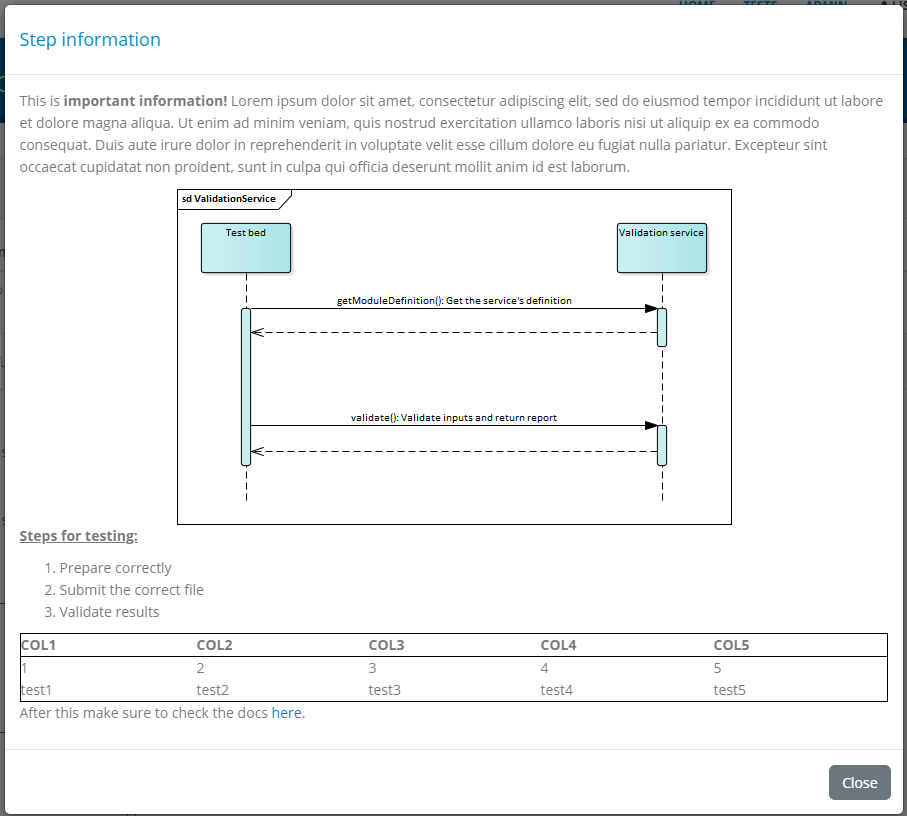
Clicking the Close button or anywhere outside the popup will dismiss it and refocus the test execution diagram.
Note
Test documentation and instructions: Providing extended documentation for key steps is a good way of enriching the feedback provided to
users. This documentation can be used to provide detailed instructions or references to the specifications being tested, complementing the
limited information presented through test step labels, or test case and test suite descriptions. Such documentation is added in the test
cases’ GITB TDL content by means of the test steps’ documentation element.
View test step results
During test case execution, additional controls are made available to allow you to inspect the ongoing test(s) results.
First of all, if multiple test cases are selected for execution, completed test case sessions can be inspected by clicking Options, selecting to show completed tests and clicking their relevant row. Doing so will expand the clicked row to display the relevant test execution diagram.
Regarding the test steps within a given test session, each completed step is a displayed with a status icon that highlights on hover (green for success, orange for warning or red for failure). This applies for validation, messaging, processing and interaction steps.
Apart from serving as an additional indication on the success or failure of the test step, these controls provide further details on the step’s results. Clicking them triggers a popup that shows the different information elements that can be viewed inline or opened in a separate popup editor. In the case of validation steps, this is extended to also provide the detailed validation results and an overview of the error, warning and information message counts, as illustrated in the following example. The different severity indicators can be toggled to show or hide the related items.

In the test step result popup you are presented with the result and completion time as the step summary. In the sections that follow you can inspect the output information from the step, presented either inline (for short values), as a file you can download, or through a further popup editor. These two latter options are available by clicking the download or view icons respectively at the right of each section. In case you choose to view the content in an editor, a popup is presented that displays the content which, in the case of validation steps, is also highlighted for the recorded validation messages.
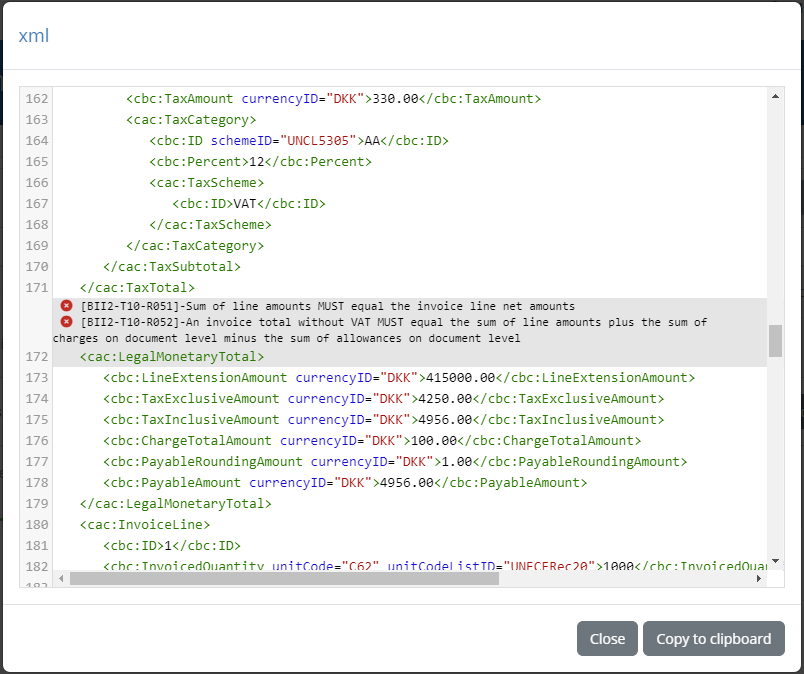
The editor popup allows you to copy a specific part of the content or, by means of the Copy to clipboard button, copy its entire contents. The Close button closes this popup and returns you to the test step result display. Note that clicking on a specific error will open the validated content and automatically focus on the selected error.
An alternative to viewing the content in this way is to click the Download button which will download the content as a file. The Test Bed will determine the most appropriate type for the content and name the downloaded file accordingly (if possible). In the case of simple texts that are presented inline, you are not presented with the download and view buttons, but rather with a Copy to clipboard button that allows you to copy the presented value.
Note
Viewing binary output: Images are presented as a preview when selecting to view them. For other binary content (e.g. a PDF document), the best way to inspect it is to download it. Opening such content in the in-place code editor will still be possible, but this will most likely not be useful.
The errors, warnings and information messages displayed are contained in a details section that also shows the overall counts per violation severity level. This summary title is also clickable, to allow the listed details to be collapsed or expanded if already collapsed. Collapsing the displayed details could be useful in case they are numerous, providing as such easier access to the popup’s additional controls.
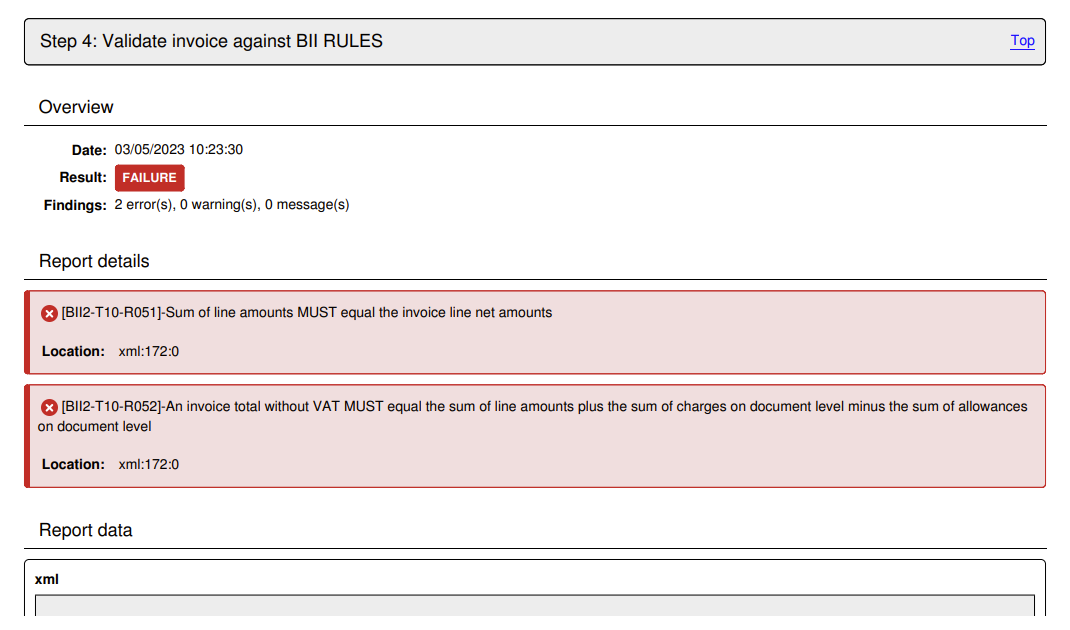
The results of the test step can also be exported as a test step report (in PDF and XML format). This is made available through the Download report button and its additional Download report as XML option, that trigger the generation and download of the step report in the desired format. The following example presents such a report in PDF.
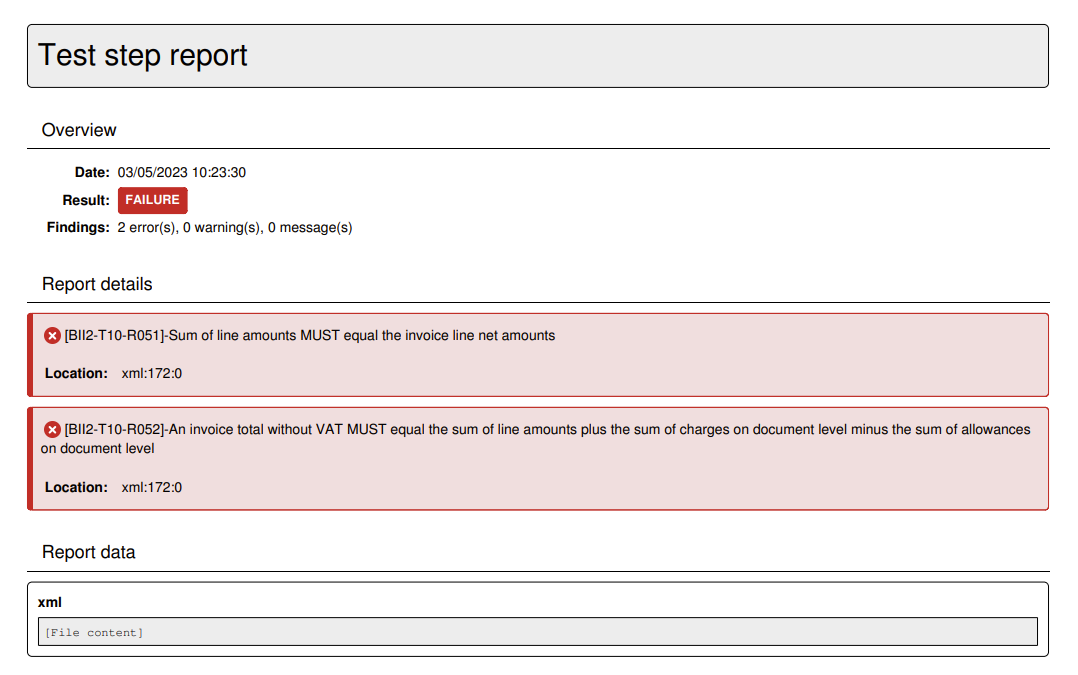
The PDF report includes:
The test step result overview, including the result, date and, in case of a validation step, the total number of validation findings (classified as errors, warnings and messages).
The report details, included in case of a validation step to list the details of the validation report’s findings.
The report data matching the step’s input and output data. Note that only text values are presented in full and are truncated if too long.
When selecting to download the report as XML, you receive similar information but represented in XML for simpler machine-processing. The structure of the report is defined by the GITB Test Reporting Language (GITB TRL), with the following being a simple sample:
<?xml version="1.0" encoding="UTF-8" standalone="yes"?>
<TestStepReport xmlns="http://www.gitb.com/tr/v1/" xmlns:ns2="http://www.gitb.com/core/v1/" xmlns:ns3="http://www.gitb.com/tbs/v1/" xmlns:xsi="http://www.w3.org/2001/XMLSchema-instance" xsi:type="TAR" name="Schematron Validation" id="4">
    <date>2022-10-14T15:21:30.250+02:00</date>
    <result>FAILURE</result>
    <counters>
        <nrOfAssertions>0</nrOfAssertions>
        <nrOfErrors>2</nrOfErrors>
        <nrOfWarnings>0</nrOfWarnings>
    </counters>
    <reports>
        <error xsi:type="BAR">
            <description>[BII2-T10-R051]-Sum of line amounts MUST equal the invoice line net amounts</description>
            <location>xml:172:0</location>
        </error>
        <error xsi:type="BAR">
            <description>[BII2-T10-R052]-An invoice total without VAT MUST equal the sum of line amounts plus the sum of charges on document level minus the sum of allowances on document level</description>
            <location>xml:172:0</location>
        </error>
    </reports>
</TestStepReport>
Finally, it is important to point out that the examination of a test session’s result, both in terms of steps and message exchanges, as well as detailed test step results, is possible at any time through your test session history (see View your test history).
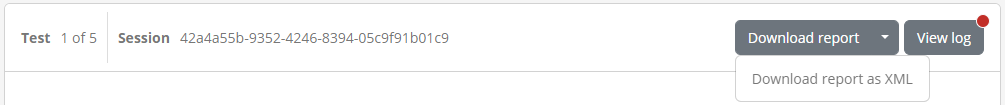
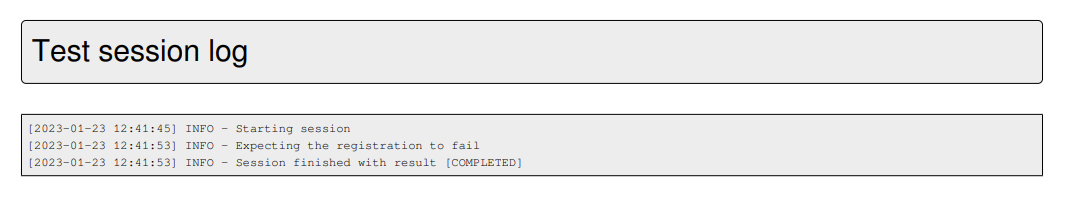
View test session log
During any point in a test session’s execution, be it an active or completed test session, you may view its detailed log output. This is done by clicking the View log button in the top right corner of the test execution diagram. This button displays also a status indicator as a circle in case the log includes new messages since the last time it was viewed. Furthermore, this indicator will be orange or red in case the log includes respectively warnings or errors.
Clicking this button will open a popup window that includes the detailed log output (debug statements, information messages, warnings and errors) for your test session.
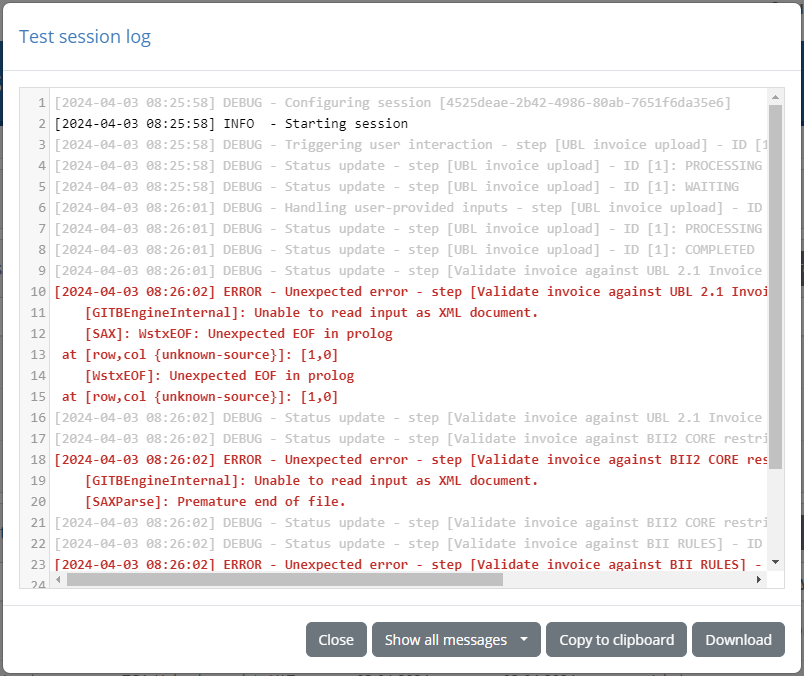
The detailed log output is typically very useful when you receive error messages but for which the description provided is not clear. The log output may be used in such a case to determine the cause of the problem or, for unexpected issues, provide input to the Test Bed support team (see Contact support). Note that once opened, the log display is automatically updated for newly received messages.
The displayed log messages are highlighted with different colours depending on their severity:
Light grey for debug messages.
Black for information messages.
Orange for warnings.
Red for errors.
Finally, the popup’s includes controls to manage the log display. Specifically you may:
Choose to automatically follow the latest messages (i.e. tail) or maintain your scroll position.
Select the minimum severity to display (by default all messages are displayed).
Copy the log to your clipboard.
Download the log as a text file.
Close the popup.
Export test session report
Once a test session has completed it is also possible to export its report in PDF or XML, using the Export report as PDF and Export report as XML buttons respectively.
The XML export format of this report is defined by the GITB Test Reporting Language (GITB TRL), and is suitable for machine-based processing. The following XML content is a sample of such a report:
<?xml version="1.0" encoding="UTF-8" standalone="yes"?>
<TestCaseOverviewReport xmlns="http://www.gitb.com/tr/v1/" xmlns:ns2="http://www.gitb.com/core/v1/" xmlns:ns3="http://www.gitb.com/tbs/v1/" id="UBL_invoice_validation_test_3">
    <metadata>
        <ns2:name>TC3: Upload minimal invoice</ns2:name>
        <ns2:description>Test case to verify the correctness of a minimal UBL invoice. The invoice is provided manually through user upload.</ns2:description>
    </metadata>
    <sessionId>6f7df938-8478-49ea-9626-97ba5d611f0e</sessionId>
    <startTime>2022-10-14T15:21:14.000+02:00</startTime>
    <endTime>2022-10-14T15:21:31.000+02:00</endTime>
    <result>FAILURE</result>
    <message>The provided invoice failed validation. Check the failed validation step(s) for further details.</message>
    <steps>
        <step id="1">
            <description>Step 1: UBL invoice upload</description>
            <report xmlns:xsi="http://www.w3.org/2001/XMLSchema-instance" xsi:type="TAR" id="1">
                <date>2022-10-14T15:21:25.767+02:00</date>
                <result>SUCCESS</result>
            </report>
        </step>
        <step id="2">
            <description>Step 2: Validate invoice against UBL 2.1 Invoice Schema</description>
            <report xmlns:xsi="http://www.w3.org/2001/XMLSchema-instance" xsi:type="TAR" name="XML Schema Validation" id="2">
                <date>2022-10-14T15:21:25.853+02:00</date>
                <result>SUCCESS</result>
                <counters>
                    <nrOfAssertions>0</nrOfAssertions>
                    <nrOfErrors>0</nrOfErrors>
                    <nrOfWarnings>0</nrOfWarnings>
                </counters>
                <reports/>
            </report>
        </step>
        <step id="3">
            <description>Step 3: Validate invoice against BII2 CORE restrictions for Invoice Transaction</description>
            <report xmlns:xsi="http://www.w3.org/2001/XMLSchema-instance" xsi:type="TAR" name="Schematron Validation" id="3">
                <date>2022-10-14T15:21:29.756+02:00</date>
                <result>SUCCESS</result>
                <counters>
                    <nrOfAssertions>0</nrOfAssertions>
                    <nrOfErrors>0</nrOfErrors>
                    <nrOfWarnings>1</nrOfWarnings>
                </counters>
                <reports>
                    <warning xsi:type="BAR">
                        <description>Attribute '@listID' marked as not used in the given context.</description>
                        <location>xml:12:0</location>
                    </warning>
                </reports>
            </report>
        </step>
        <step id="4">
            <description>Step 4: Validate invoice against BII RULES</description>
            <report xmlns:xsi="http://www.w3.org/2001/XMLSchema-instance" xsi:type="TAR" name="Schematron Validation" id="4">
                <date>2022-10-14T15:21:30.250+02:00</date>
                <result>FAILURE</result>
                <counters>
                    <nrOfAssertions>0</nrOfAssertions>
                    <nrOfErrors>2</nrOfErrors>
                    <nrOfWarnings>0</nrOfWarnings>
                </counters>
                <reports>
                    <error xsi:type="BAR">
                        <description>[BII2-T10-R051]-Sum of line amounts MUST equal the invoice line net amounts</description>
                        <location>xml:172:0</location>
                    </error>
                    <error xsi:type="BAR">
                        <description>[BII2-T10-R052]-An invoice total without VAT MUST equal the sum of line amounts plus the sum of charges on document level minus the sum of allowances on document level</description>
                        <location>xml:172:0</location>
                    </error>
                </reports>
            </report>
        </step>
    </steps>
</TestCaseOverviewReport>
The report includes the following information:
The identifier, name and description of the test case.
The start, end time and identifier for the session.
The overall result as well as the output message that may have been produced.
The list of step reports that include each step’s identifier, description, timestamp, result and findings (if validations were carried out).
The PDF report includes similar information to its XML counterpart with certain additional context data. The following sample report illustrates the information included:
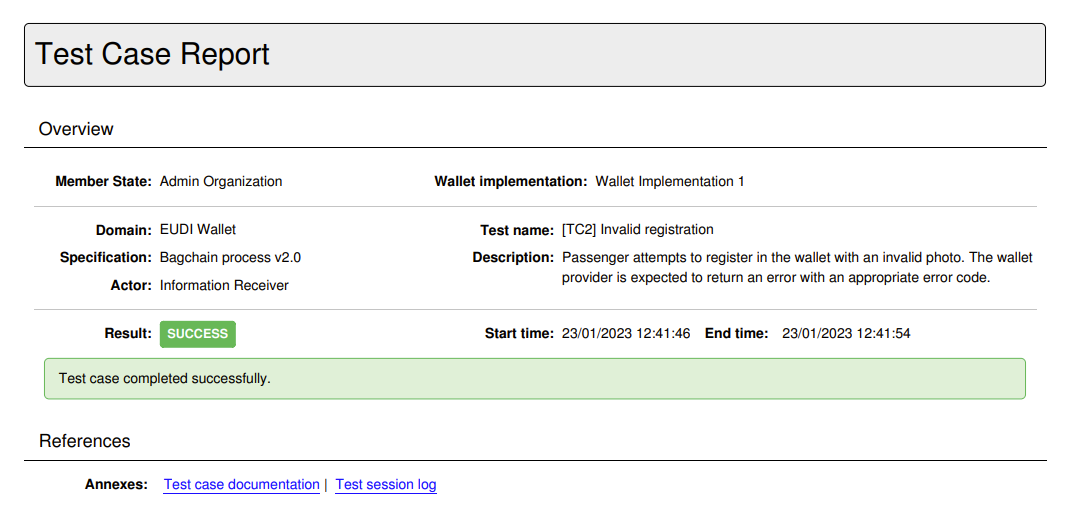
The report contains a first overview section that summarises the purpose and result of the test session. The information included here is:
The name of the system that was tested and the name of its related organisation.
The names of the domain, specification and actor of the relevant conformance statement.
The test case’s name and description.
The session’s result, start and end time.
The session’s output message if one was produced.
Below the overview information follow the test case’s references where, as available, you are provided with links to additional information included as annexes in the report. These may be:
The extended documentation of the test case.
The test session log.
This first page is followed by the section on the test case’s step reports. All steps are initially presented as an overview including per step, its description and result. The detailed step reports follow this overview, with individual reports being directly accessible by clicking each step’s sequence identifier that prefixes its description.
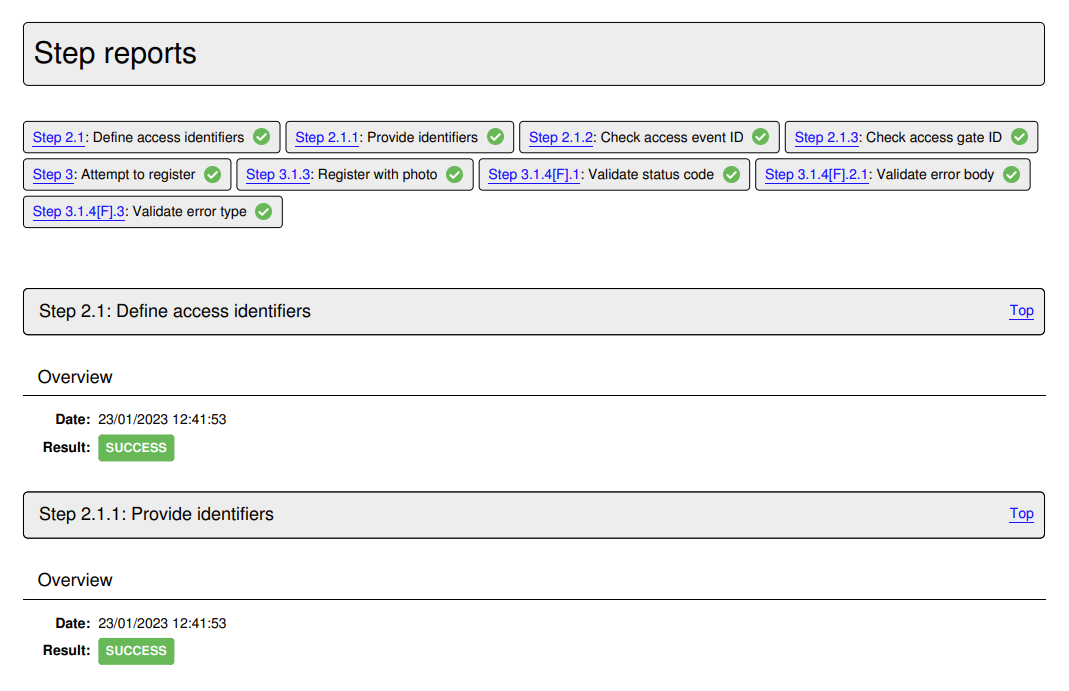
Each detailed step report includes the following information for its step:
Its sequence number and description in its header, that also includes a link to return to the steps’ overview section.
Its result and completion time.
The number of validation report findings classified as errors, warnings and messages (if applicable).
A report details section listing the details of each validation finding (if applicable).
A report data section listing the step’s input and output. Note that only text values are presented here and are truncated if too long.
At the end of the test case report follow the report’s annexes, specifically the test case’s documentation and the produced log output.
Regarding the log output, this is limited to messages reported at information level thus excluding debugging output that could be quite long for elaborate test cases.
Note
The XML report for a given test session can also be obtained through the Test Bed’s REST API (if enabled for your Test Bed instance).
Export test session data
Besides downloading the test session report, completed sessions also provide the option of downloading their complete test session data.
When selected, this downloads a ZIP archive for the test session that includes:
The test case report in XML format, extended to include the data of individual test steps.
A data folder including files, each named using a unique identifier.
The files in the data folder correspond to step data that is binary or too large to include directly in the XML report.
Where such files are present, their identifiers are referenced in the XML report in place of their value. In the following
example, identifier c889a5ca-466d-4c3e-81b3-7f2174ef2d2e refers to the name of a large text file that can be found in
the data folder.
...
<step id="1">
    <context type="map">
        ...
        <ns2:item name="body" embeddingMethod="BASE64" type="binary" mimeType="text/plain">
            <ns2:value>___[[c889a5ca-466d-4c3e-81b3-7f2174ef2d2e]]___</ns2:value>
        </ns2:item>
    </context>
<step>
...
Execution via REST API
Apart from launching tests through its user interface, the Test Bed also provides a REST API allowing you to manage test sessions via REST calls. Specifically you may use the API to:
Start test sessions.
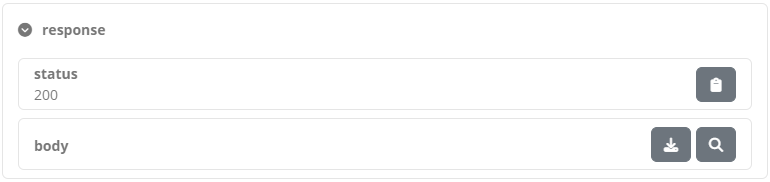
Consult test sessions’ status, logs and reports.
Stop test sessions.
Details on each operation, including sample requests and responses, are provided in the REST API documentation.
Note
The Test Bed’s REST API is an advanced feature that needs to first be enabled by your administrator before it can be used.
View your test history
To view your organisation’s test history click the My test sessions link from the side menu. Doing so presents you with the test session history screen which is split into three main parts:
A set of search filters to help locating specific test results.
The list of active test sessions.
The list of completed test sessions.
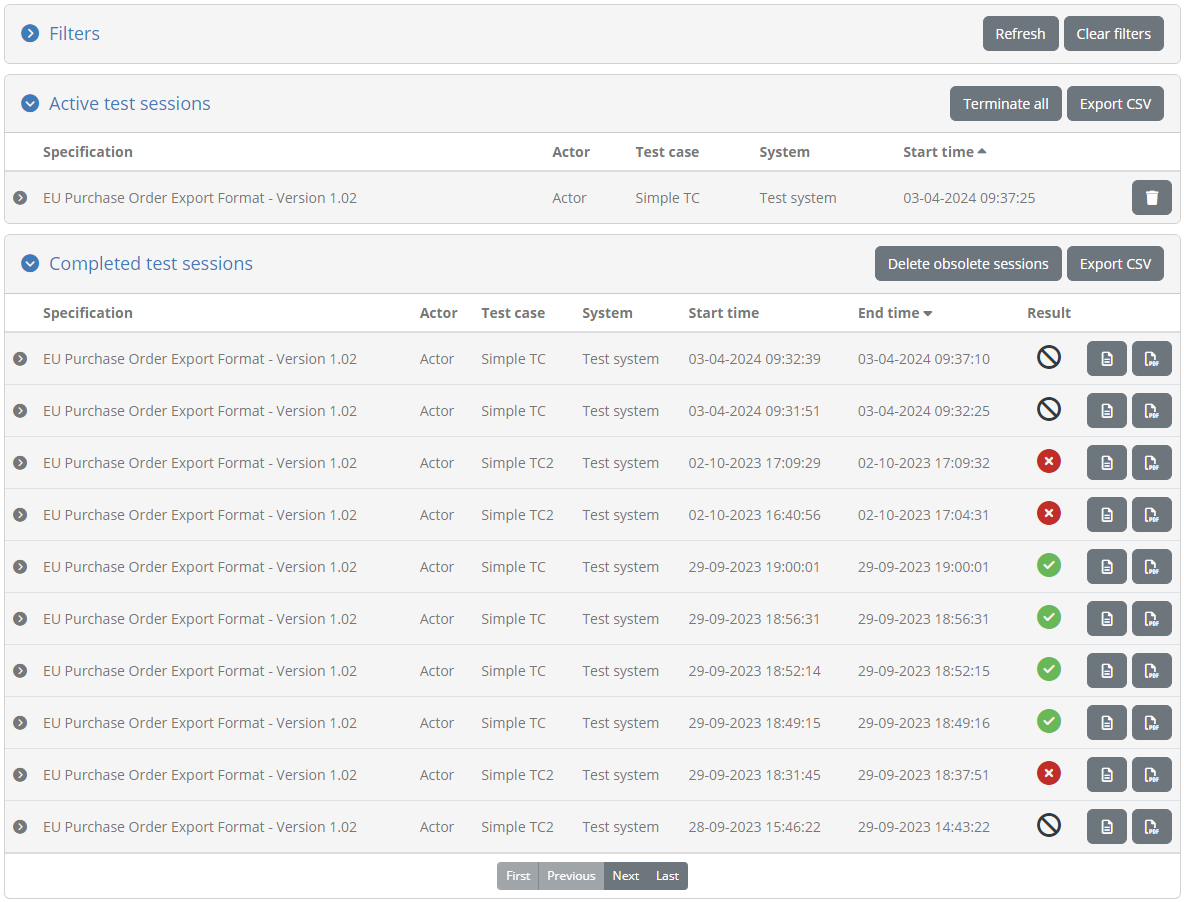
Active test sessions
The currently active sessions are those that are pending completion. These could be sessions that are running in the background or sessions that are interactively being executed by other users.
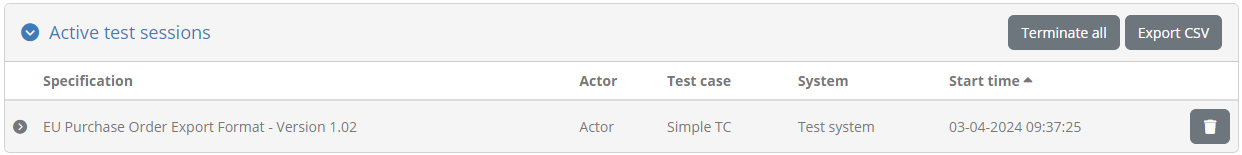
Tests are presented in a paged table sorted based on their start time in a ascending order (i.e. the oldest sessions are presented first). Custom sorting can be applied by clicking the title of each column; clicking a column header for the first time will sort by it in ascending manner and clicking it again will switch to descending. The active sort column and type are indicated using an arrow next to the relevant column header. As is the case with all table displays, you may use controls to go to specific pages as well as the first, previous, next and last ones (as applicable), while showing in the bottom right corner the total and currently displayed test counts. You can also select the number of rows displayed per page, a setting that when changed will also be saved in your user preferences.
Each session is presented on a separate table row, displaying per session:
The specification and actor (defined as the test case’s SUT).
The relevant test case.
The relevant system.
The session start time.
The set of currently displayed active sessions can be exported in CSV format by clicking the Export CSV button in the table header (see Export test sessions). You may also click the Terminate all button that, upon confirmation, will forcibly stop all currently active tests. Finally, the header itself can also be clicked to collapse or expand its display.
Regarding individual active test sessions, each session’s row offers controls to:
Forcibly terminate it, by clicking the delete icon on the relevant session’s row.
View its details, by clicking on the row itself (see View test session details).
Completed test sessions
The history of all your completed test sessions is presented in the Completed test sessions table.
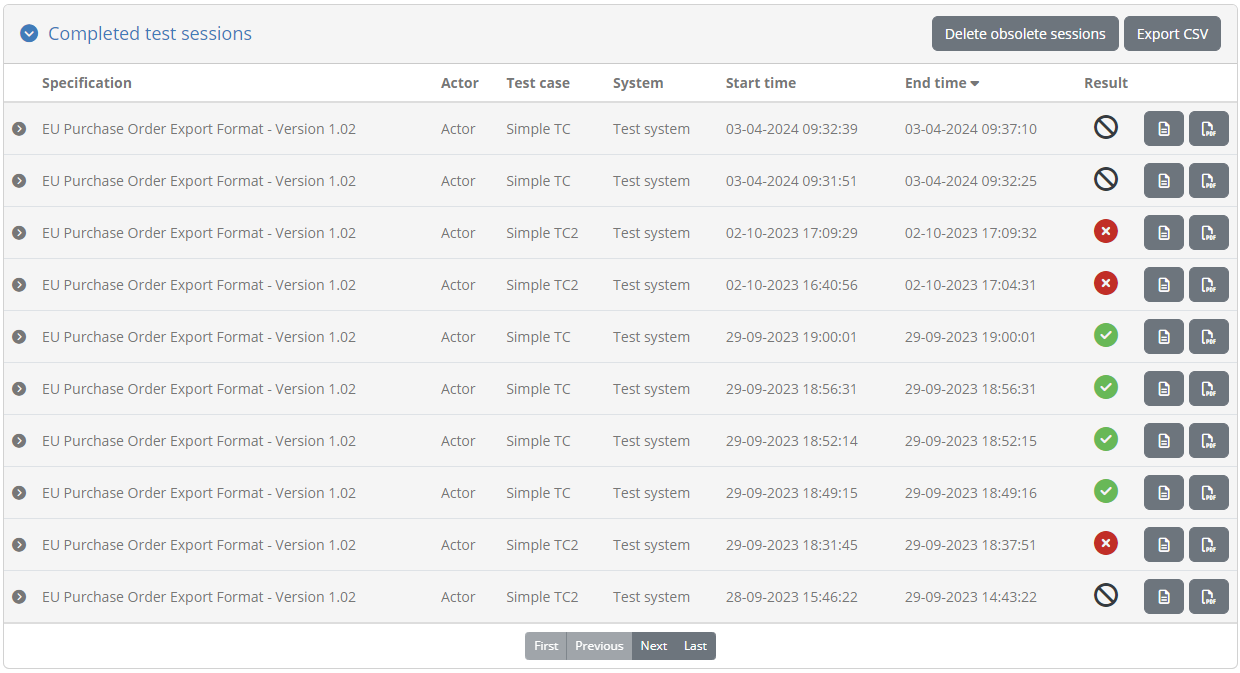
Tests are presented in a paged table sorted based on their end time in a descending order (i.e. showing the latest tests at the top). Custom sorting can be applied by clicking the title of each column; clicking a column header for the first time will sort by it in ascending manner and clicking it again will switch to descending. The active sort column and type are indicated using an arrow next to the relevant column header. As is the case with all table displays, you may use controls to go to specific pages as well as the first, previous, next and last ones (as applicable), while showing in the bottom right corner the total and currently displayed test counts. You can also select the number of rows displayed per page, a setting that when changed will also be saved in your user preferences.
Test sessions are displayed one per table row, with each row including the following information:
The specification and actor of the test session.
The relevant test case.
The relevant system.
The session’s start and end time.
The test result.
Each row provides a control with further options to export the relevant test case report and to view the test’s steps. In addition, you can use the overall Export CSV button from the table’s header to extract a CSV export of the currently displayed sessions (see Export test sessions). Finally, the header itself can also be clicked to collapse or expand its display.
Note
Obsolete test sessions: One or more test sessions may be rendered obsolete in case of a significant change in the test setup (e.g. the relevant specification being deleted) or a test case update that requires relevant test sessions to be re-executed. Such test sessions remain and can be consulted but are displayed greyed-out to indicate that they are no longer considered towards your overall conformance testing.
Apply search filters
To locate specific test sessions you are provided with a set of filter controls at the top of the screen. These are presented initially as collapsed as they are not taken into account, but can be clicked to expand and set specific filter criteria.
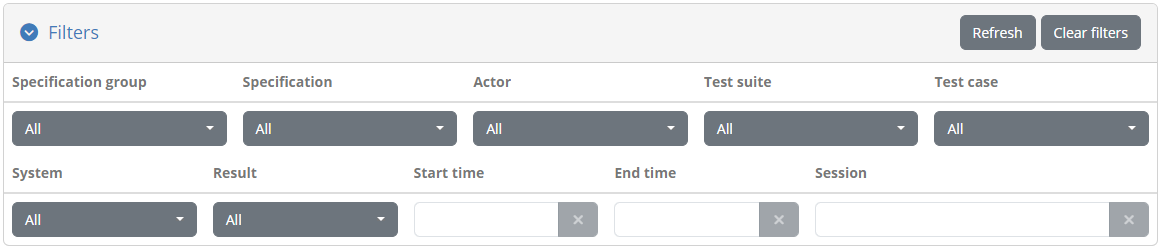
The available filters are:
The domain (if applicable), specification group, specification and actor of the sessions’ corresponding conformance statements.
The relevant’ test suite and test case.
The relevant’ system.
The sessions’ result, start and end time.
A specific session ID.
All filter controls with the exception of the start time, end time and session ID are multiple selection choices. The session ID is provided through a text field, whereas the start and end time controls are date pickers that allow selection of ranges of dates for both the start and end of the sessions. Shortcuts are also provided here allowing you to select predefined and common ranges.

Selecting multiple values across these controls are applied as follows:
Within a specific filter control using “OR” logic (e.g. selecting multiple specifications).
Across filter controls using “AND” logic (e.g. selecting a specification and a test case).
Note additionally that selecting dependent values serves to limit the filter options that are presented. For example if a given specification is selected, the test suites and test cases available for filtering will be limited to that specification to already exclude impossible combinations.
The presented tests are automatically updated whenever your filter options are modified, or when the filters are removed altogether by clicking the Clear filters button. It is also possible to collapse the filters without disabling them by clicking on the filter panel header. Note that displaying the performed tests with no filtering is the default when you first visit the screen. Finally, you may also choose to keep the current filtering but refresh the search results by clicking the Refresh button.
Export a test case report
Exporting a test case’s report is possible for completed test sessions, by clicking the option button on the far right side of each test’s row. The presented options allow you to download the test session report in PDF or XML format.
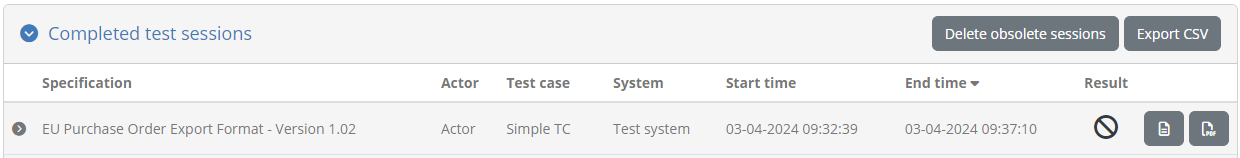
The format of the XML report is defined by the GITB Test Reporting Language (GITB TRL), and is meant for machine-based processing. The following XML content is a sample of such a report:
<?xml version="1.0" encoding="UTF-8" standalone="yes"?>
<TestCaseOverviewReport xmlns="http://www.gitb.com/tr/v1/" xmlns:ns2="http://www.gitb.com/core/v1/" xmlns:ns3="http://www.gitb.com/tbs/v1/" id="UBL_invoice_validation_test_3">
    <metadata>
        <ns2:name>TC3: Upload minimal invoice</ns2:name>
        <ns2:description>Test case to verify the correctness of a minimal UBL invoice. The invoice is provided manually through user upload.</ns2:description>
    </metadata>
    <sessionId>6f7df938-8478-49ea-9626-97ba5d611f0e</sessionId>
    <startTime>2022-10-14T15:21:14.000+02:00</startTime>
    <endTime>2022-10-14T15:21:31.000+02:00</endTime>
    <result>FAILURE</result>
    <message>The provided invoice failed validation. Check the failed validation step(s) for further details.</message>
    <steps>
        <step id="1">
            <description>Step 1: UBL invoice upload</description>
            <report xmlns:xsi="http://www.w3.org/2001/XMLSchema-instance" xsi:type="TAR" id="1">
                <date>2022-10-14T15:21:25.767+02:00</date>
                <result>SUCCESS</result>
            </report>
        </step>
        <step id="2">
            <description>Step 2: Validate invoice against UBL 2.1 Invoice Schema</description>
            <report xmlns:xsi="http://www.w3.org/2001/XMLSchema-instance" xsi:type="TAR" name="XML Schema Validation" id="2">
                <date>2022-10-14T15:21:25.853+02:00</date>
                <result>SUCCESS</result>
                <counters>
                    <nrOfAssertions>0</nrOfAssertions>
                    <nrOfErrors>0</nrOfErrors>
                    <nrOfWarnings>0</nrOfWarnings>
                </counters>
                <reports/>
            </report>
        </step>
        <step id="3">
            <description>Step 3: Validate invoice against BII2 CORE restrictions for Invoice Transaction</description>
            <report xmlns:xsi="http://www.w3.org/2001/XMLSchema-instance" xsi:type="TAR" name="Schematron Validation" id="3">
                <date>2022-10-14T15:21:29.756+02:00</date>
                <result>SUCCESS</result>
                <counters>
                    <nrOfAssertions>0</nrOfAssertions>
                    <nrOfErrors>0</nrOfErrors>
                    <nrOfWarnings>1</nrOfWarnings>
                </counters>
                <reports>
                    <warning xsi:type="BAR">
                        <description>Attribute '@listID' marked as not used in the given context.</description>
                        <location>xml:12:0</location>
                    </warning>
                </reports>
            </report>
        </step>
        <step id="4">
            <description>Step 4: Validate invoice against BII RULES</description>
            <report xmlns:xsi="http://www.w3.org/2001/XMLSchema-instance" xsi:type="TAR" name="Schematron Validation" id="4">
                <date>2022-10-14T15:21:30.250+02:00</date>
                <result>FAILURE</result>
                <counters>
                    <nrOfAssertions>0</nrOfAssertions>
                    <nrOfErrors>2</nrOfErrors>
                    <nrOfWarnings>0</nrOfWarnings>
                </counters>
                <reports>
                    <error xsi:type="BAR">
                        <description>[BII2-T10-R051]-Sum of line amounts MUST equal the invoice line net amounts</description>
                        <location>xml:172:0</location>
                    </error>
                    <error xsi:type="BAR">
                        <description>[BII2-T10-R052]-An invoice total without VAT MUST equal the sum of line amounts plus the sum of charges on document level minus the sum of allowances on document level</description>
                        <location>xml:172:0</location>
                    </error>
                </reports>
            </report>
        </step>
    </steps>
</TestCaseOverviewReport>
The report includes the following information:
The identifier, name and description of the test case.
The start, end time and session identifier.
The overall result as well as the output message that may have been produced.
The list of step reports that include each step’s identifier, description, timestamp, result and findings (if validations were carried out).
The other available report option is the test session’s PDF report.
The PDF report includes similar information to its XML counterpart with certain additional context data. The following sample report illustrates the information included:
The report contains a first overview section that summarises the purpose and result of the test session. The information included here is:
The name of the system that was tested and the name of its related organisation.
The names of the domain, specification and actor of the relevant conformance statement.
The test case’s name and description.
The session’s result, start time, end time and identifier.
The session’s output message if one was produced.
Below the overview information follow the test case’s references where, as available, you are provided with links to additional information included as annexes in the report. These may be:
The extended documentation of the test case.
The test session log.
This first page is followed by the section on the test case’s step reports. All steps are initially presented as an overview including per step, its description and result. The detailed step reports follow this overview, with individual reports being directly accessible by clicking each step’s sequence identifier that prefixes its description.
Each detailed step report includes the following information for its step:
Its sequence number and description in its header, that also includes a link to return to the steps’ overview section.
Its result and completion time.
The number of validation report findings classified as errors, warnings and messages (if applicable).
A report details section listing the details of each validation finding (if applicable).
A report data section listing the step’s input and output. Note that only text values are presented here and are truncated if too long.
At the end of the test case report follow the report’s annexes, specifically the test case’s documentation and the produced log output.
Regarding the log output, this is limited to messages reported at information level thus excluding debugging output that could be quite long for elaborate test cases.
Note
The XML report for a given test session can also be obtained through the Test Bed’s REST API (if enabled for your Test Bed instance).
Export test sessions
Apart from exporting an individual test case report you can also export the information for the currently displayed test sessions in CSV format. To do this click the Export CSV button in the right of the active or completed test session table header.

Delete obsolete test results
Obsolete test sessions can be deleted by clicking the Delete obsolete sessions button from the search results’ panel.
Doing so will first prompt you for confirmation and then, if confirmed, will proceed to delete the obsolete test results.
View test session details
Each row from the list of presented test sessions, both active and completed, may also be clicked to view its detailed information. Doing so expands the row to present the test session’s steps in a manner similar to the live test execution diagram displayed while the test session is active (see Test execution).
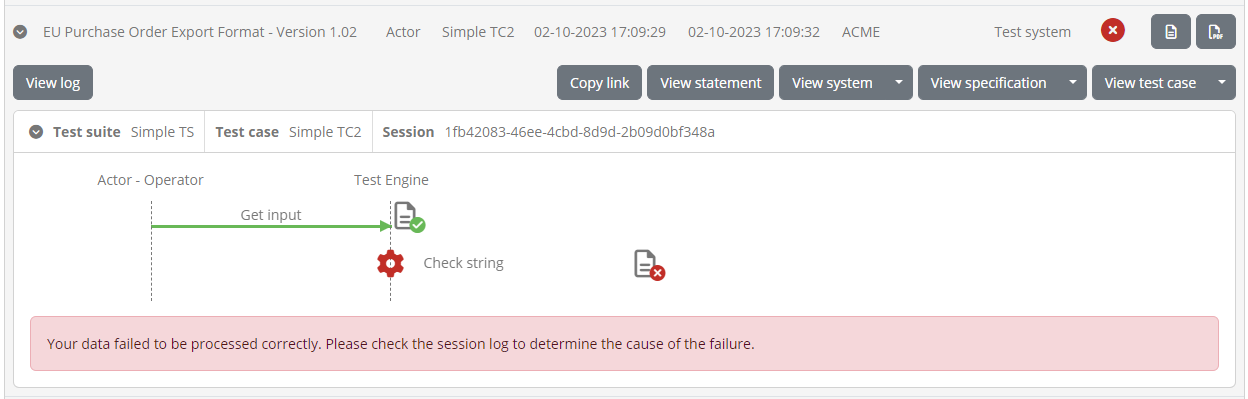
In terms of provided controls, each completed step is displayed with a status icon and a status-specific highlight when hovered, and can be clicked to review its details (see View test step details). In addition, the diagram’s header presents the session’s test suite, test case and session identifier. The session identifier may also be clicked to copy it to the clipboard, which could be useful if you would want to communicate it to others or to use it for search filtering. Furthermore, clicking elsewhere on the header of the diagram display will collapse (or expand) the diagram, which could be useful if you want to quickly view other information on the screen.
Above the diagram display you are presented with additional buttons linked to the test session. The purpose of these are as follows:
View log opens up the test session log for display, displaying its contents similarly to when the session is executing.
Copy link copies a shareable external link to focus on the current test session. You also have here a Copy link for administrator option in case you want to share the link with an administrator.
View statement takes you to the relevant conformance statement, with additional options to view the related system, organisation, specification, actor, domain, test case and test suite.
In the case of an active test session you are also provided with a button to refresh its display and view pending interactions (in case interactions are pending).

Refreshing the display allows you to track the progress of a specific test session without needing to make a full refresh of the displayed results. Clicking this button will refresh only the relevant test session and reflect changes on its diagram. Note that it is possible that upon refresh, the test session has in the meanwhile completed, in which case a relevant information popup will inform you accordingly. In case of a pending interaction, clicking to view it will present it so that it can be completed and allow the session to proceed. This allows you to have test sessions execute in the background while checking through this screen on whether they need user interactions.
Clicking on the session row will once again collapse the display. Note that once one or more session details are expanded the table’s header will display a Collapse all button that can be clicked to collapse all details.
View test step details
Clicking on a step’s document icon triggers a popup that shows the step’s different information elements that can be viewed inline, downloaded or opened in a separate popup editor. In the case of validation steps, this is extended to also provide the detailed results and report counters as illustrated in the following example for a validation failure.
In the test step result popup you are presented with the result and completion time as the step summary. In the sections that follow you can inspect the output information from the step, presented either inline (for short values), as a file you can download, or through a further popup editor. In the latter case this is triggered by clicking the View button. Clicking to open this, displays its content which, in the case of validation steps, is also highlighted for the recorded validation messages.
The editor popup allows you to copy a specific part of the content or, by means of the Copy to clipboard button, copy its entire contents. The Close button closes this popup and returns you to the test step result display. Note that clicking on a specific error will open the validated content and automatically focus on the selected error.
An alternative to viewing the content in this way is to click the Download button which will download the content as a file. The Test Bed will determine the most appropriate type for the content and name the downloaded file accordingly (if possible). In the case of simple texts that are presented inline, you are not presented with the download and view buttons, but rather with a Copy to clipboard button that allows you to copy the presented value.
Note
Viewing binary output: Images are presented as a preview when selecting to view them. For other binary content (e.g. a PDF document), the best way to inspect it is to download it. Opening such content in the in-place code editor will still be possible, but this will most likely not be useful.
Export test step report
The results of the test step can also be exported as a test step report in PDF and XML formats. This is made available through the Download report button for PDF, and its Download report as XML additional option for XML, that will trigger the generation and download of the report in the requested format. The following example represents such a report in PDF.
This PDF report includes:
The test step result overview, including the result, date and, in case of a validation step, the total number of validation findings (classified as errors, warnings and messages).
The report details, included in case of a validation step to list the details of the validation report’s findings.
When selecting to download the report as XML, you receive similar information but represented in XML for simpler machine-processing. The structure of the report is defined by the GITB Test Reporting Language (GITB TRL), with the following being a simple sample:
<?xml version="1.0" encoding="UTF-8" standalone="yes"?>
<TestStepReport xmlns="http://www.gitb.com/tr/v1/" xmlns:ns2="http://www.gitb.com/core/v1/" xmlns:ns3="http://www.gitb.com/tbs/v1/" xmlns:xsi="http://www.w3.org/2001/XMLSchema-instance" xsi:type="TAR" name="Schematron Validation" id="4">
    <date>2022-10-14T15:21:30.250+02:00</date>
    <result>FAILURE</result>
    <counters>
        <nrOfAssertions>0</nrOfAssertions>
        <nrOfErrors>2</nrOfErrors>
        <nrOfWarnings>0</nrOfWarnings>
    </counters>
    <reports>
        <error xsi:type="BAR">
            <description>[BII2-T10-R051]-Sum of line amounts MUST equal the invoice line net amounts</description>
            <location>xml:172:0</location>
        </error>
        <error xsi:type="BAR">
            <description>[BII2-T10-R052]-An invoice total without VAT MUST equal the sum of line amounts plus the sum of charges on document level minus the sum of allowances on document level</description>
            <location>xml:172:0</location>
        </error>
    </reports>
</TestStepReport>