Monitor test sessions
Monitoring all current and past test sessions for your community is possible through the Session dashboard screen, accessible by clicking the corresponding link from the menu.
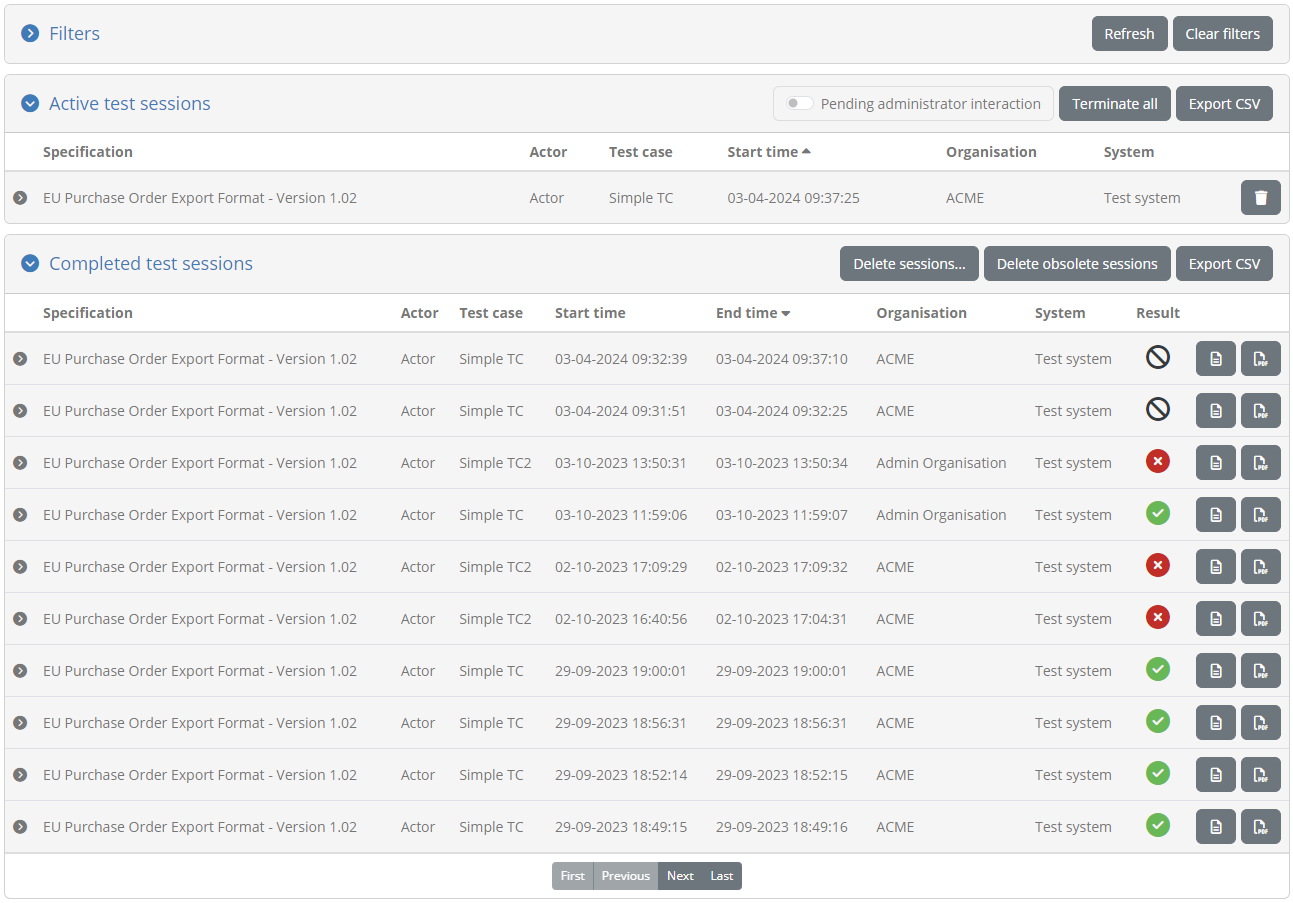
The screen is split in three sections:
A set of search filters, initially disabled, to find specific test sessions (see Apply search filters).
The list of currently active sessions (see Active test sessions).
The list of completed sessions (see Completed test sessions).
Active test sessions
The currently active sessions are those that are pending completion. These could be sessions actively being used by the Test Bed’s users or ones that due to technical issues have been blocked.
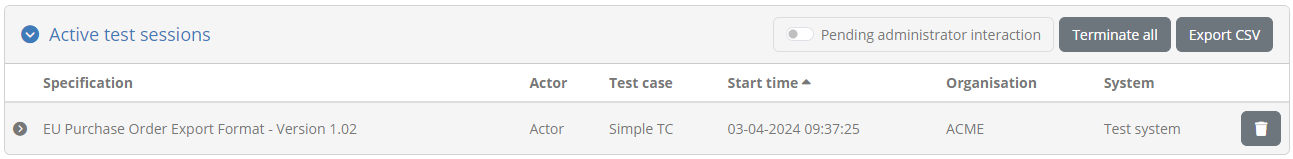
Tests are presented in a paged table sorted based on their start time in a ascending order (i.e. the oldest sessions are presented first). Custom sorting can be applied by clicking the title of each column; clicking a column header for the first time will sort by it in ascending manner and clicking it again will switch to descending. The active sort column and type are indicated using an arrow next to the relevant column header. The table offers controls to go to specific pages as well as the first, previous, next and last ones (as applicable), while showing in the bottom right corner the total and currently displayed test counts.
Each session is presented on a separate table row, with the following information displayed per session:
The specification and actor (defined as the test case’s SUT).
The relevant test case.
The organisation and system this session is executed for.
The session start time.
The set of currently displayed active sessions can be exported in CSV format by clicking the Export CSV button in the table header (see Export all test sessions). In addition, the Terminate all button can be used to terminate, upon confirmation, all currently active test sessions in the community. Clicking on the header itself, allows you to collapse or expand its display. In case there are test sessions that are pending administrator input you can also check the relevant toggle to filter them, before proceeding to make the necessary interactions.
With respect to the listing of active sessions, each session’s row offers controls to:
View its details, by clicking on the session’s row (see View test session details).
Forcibly terminate, it by clicking the delete button on the relevant session’s row.
Completed test sessions
The history of all completed test sessions is presented in the Completed test sessions table.

Each session is presented in a separate row that displays the following information:
The session’s relevant specification and actor (defined as the test case’s SUT).
Its related test case.
The organisation and system this session was executed for.
Its start and end time.
Its result.
Tests are presented in a paged table sorted based on their end time in a descending order (i.e. showing the latest tests at the top). Custom sorting can be applied by clicking the title of each column; clicking a column header for the first time will sort by it in ascending manner and clicking it again will switch to descending. The active sort column and type are indicated using an arrow next to the relevant column header. The table offers controls to go to specific pages as well as the first, previous, next and last ones (as applicable), while showing in the bottom right corner the total and currently displayed test counts.
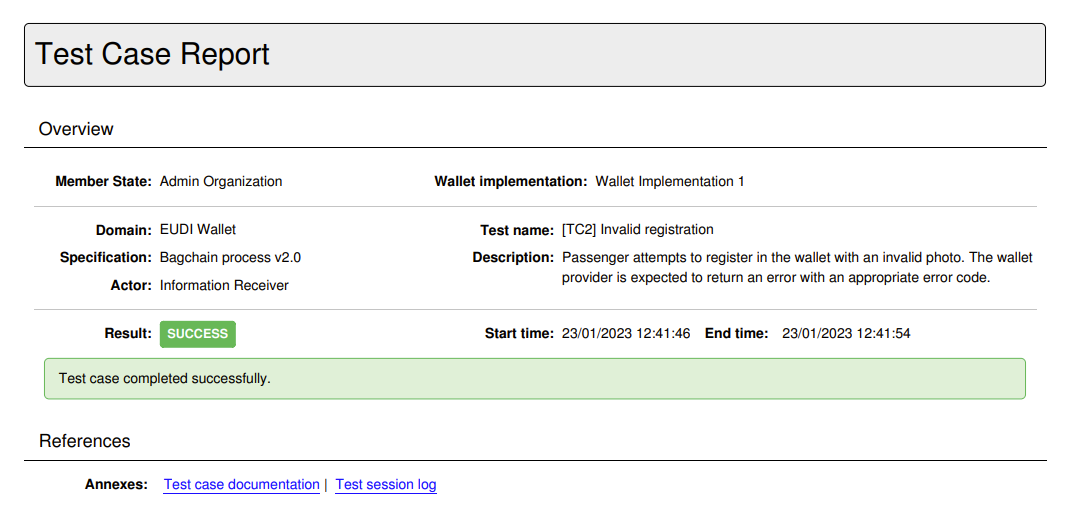
Viewing a test session’s further details and steps is done by clicking on the session’s row, similar to the case of the active test sessions. Moreover, each row provides a button to access further options, notably to download the session’s test case report in XML and PDF format, and to download the test session’s full data.
The following is an example of such a report in XML format, the XML content being defined by the GITB Test Reporting Language (GITB TRL):
<?xml version="1.0" encoding="UTF-8" standalone="yes"?>
<TestCaseOverviewReport xmlns="http://www.gitb.com/tr/v1/" xmlns:ns2="http://www.gitb.com/core/v1/" xmlns:ns3="http://www.gitb.com/tbs/v1/" id="UBL_invoice_validation_test_3">
    <metadata>
        <ns2:name>TC3: Upload minimal invoice</ns2:name>
        <ns2:description>Test case to verify the correctness of a minimal UBL invoice. The invoice is provided manually through user upload.</ns2:description>
    </metadata>
    <sessionId>6f7df938-8478-49ea-9626-97ba5d611f0e</sessionId>
    <startTime>2022-10-14T15:21:14.000+02:00</startTime>
    <endTime>2022-10-14T15:21:31.000+02:00</endTime>
    <result>FAILURE</result>
    <message>The provided invoice failed validation. Check the failed validation step(s) for further details.</message>
    <steps>
        <step id="1">
            <description>Step 1: UBL invoice upload</description>
            <report xmlns:xsi="http://www.w3.org/2001/XMLSchema-instance" xsi:type="TAR" id="1">
                <date>2022-10-14T15:21:25.767+02:00</date>
                <result>SUCCESS</result>
            </report>
        </step>
        <step id="2">
            <description>Step 2: Validate invoice against UBL 2.1 Invoice Schema</description>
            <report xmlns:xsi="http://www.w3.org/2001/XMLSchema-instance" xsi:type="TAR" name="XML Schema Validation" id="2">
                <date>2022-10-14T15:21:25.853+02:00</date>
                <result>SUCCESS</result>
                <counters>
                    <nrOfAssertions>0</nrOfAssertions>
                    <nrOfErrors>0</nrOfErrors>
                    <nrOfWarnings>0</nrOfWarnings>
                </counters>
                <reports/>
            </report>
        </step>
        <step id="3">
            <description>Step 3: Validate invoice against BII2 CORE restrictions for Invoice Transaction</description>
            <report xmlns:xsi="http://www.w3.org/2001/XMLSchema-instance" xsi:type="TAR" name="Schematron Validation" id="3">
                <date>2022-10-14T15:21:29.756+02:00</date>
                <result>SUCCESS</result>
                <counters>
                    <nrOfAssertions>0</nrOfAssertions>
                    <nrOfErrors>0</nrOfErrors>
                    <nrOfWarnings>1</nrOfWarnings>
                </counters>
                <reports>
                    <warning xsi:type="BAR">
                        <description>Attribute '@listID' marked as not used in the given context.</description>
                        <location>xml:12:0</location>
                    </warning>
                </reports>
            </report>
        </step>
        <step id="4">
            <description>Step 4: Validate invoice against BII RULES</description>
            <report xmlns:xsi="http://www.w3.org/2001/XMLSchema-instance" xsi:type="TAR" name="Schematron Validation" id="4">
                <date>2022-10-14T15:21:30.250+02:00</date>
                <result>FAILURE</result>
                <counters>
                    <nrOfAssertions>0</nrOfAssertions>
                    <nrOfErrors>2</nrOfErrors>
                    <nrOfWarnings>0</nrOfWarnings>
                </counters>
                <reports>
                    <error xsi:type="BAR">
                        <description>[BII2-T10-R051]-Sum of line amounts MUST equal the invoice line net amounts</description>
                        <location>xml:172:0</location>
                    </error>
                    <error xsi:type="BAR">
                        <description>[BII2-T10-R052]-An invoice total without VAT MUST equal the sum of line amounts plus the sum of charges on document level minus the sum of allowances on document level</description>
                        <location>xml:172:0</location>
                    </error>
                </reports>
            </report>
        </step>
    </steps>
</TestCaseOverviewReport>
Note
You can also define custom formats for any kind of XML report. This is managed as part of the community’s report settings.
Besides the XML report, you may also produce the report in PDF format:
Regarding the option to download the test data for a session, this downloads a ZIP archive that includes:
The test case report in XML format, extended to include the data of individual test steps.
A data folder including files, each named using a unique identifier.
The files in the data folder correspond to step data that is binary or too large to include directly in the XML report.
Where such files are present, their identifiers are referenced in the XML report in place of their value. In the following
example, identifier c889a5ca-466d-4c3e-81b3-7f2174ef2d2e refers to the name of a large text file that can be found in
the data folder.
...
<step id="1">
    <context type="map">
        ...
        <ns2:item name="body" embeddingMethod="BASE64" type="binary" mimeType="text/plain">
            <ns2:value>___[[c889a5ca-466d-4c3e-81b3-7f2174ef2d2e]]___</ns2:value>
        </ns2:item>
    </context>
<step>
...
Certain test results may appear greyed out in case they are to be considered as obsolete. These are tests for which linked information has significantly changed since their execution (e.g. the related organisation having been deleted). Such obsolete results are maintained by default but can be purged at any time by clicking the Delete obsolete results button.
Note
Purging obsolete sessions runs in the background as it may take several seconds to complete.
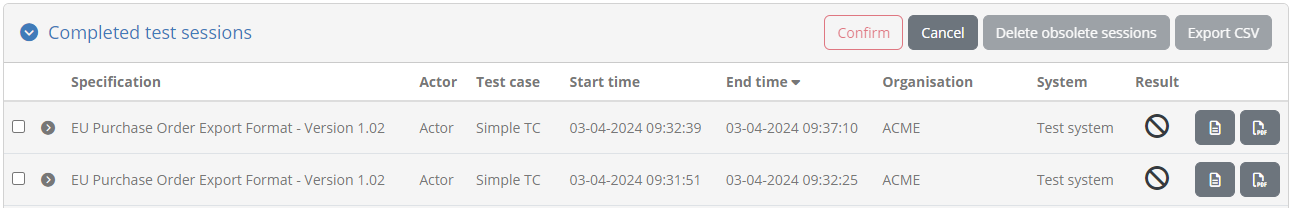
Specific test sessions can also be selectively deleted by means of the Delete sessions… button. Clicking this will disable other buttons and display a checkbox on each row in the table. To delete one or more test sessions you need to check their checkbox and click on the Confirm button. Once in selection mode you may also click on Cancel to abort the deletion and restore the normal display.
Finally, the presented completed sessions can be exported in CSV format by clicking the Export CSV button in the table header (see Export all test sessions).
Apply search filters
The session dashboard offers a set of filters that can be used to find test sessions of interest. Filters apply both to the displayed active and completed test sessions.

Filters are initially not applied and are displayed as a collapsed panel. To apply filters, click the panel to expand it.
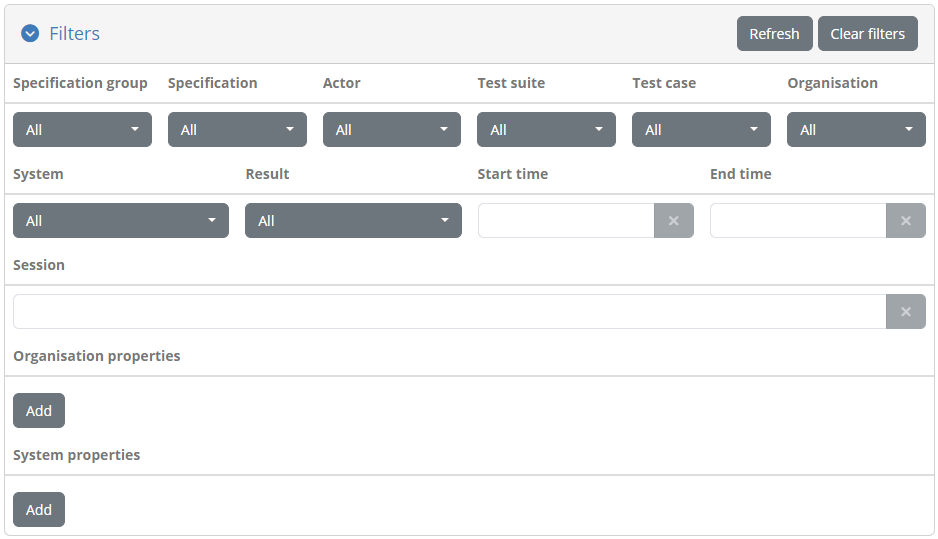
The controls that can be used for filtering are:
The sessions’ domain (if multiple), specification group, specification, actor, test suite and test case.
The relevant organisation and system.
The result.
The start and end time.
The session identifier.
Specific values for custom organisation and system properties (if such properties are defined).
Most filter controls are defined as multiple selection choices. Multiple selected values across these controls are applied as follows:
Within a specific filter control using “OR” logic (e.g. selecting multiple specifications).
Across filter controls using “AND” logic (e.g. selecting a specification and a test case).
Note additionally that selecting dependent values serves to limit the filter options that are presented. For example if a given specification is selected, the test suites and test cases available for filtering will be limited to that specification to already exclude impossible combinations.
The session identifier is a text field that allows the lookup of a specific session. The start and end time are date pickers that allow selection of ranges of dates for both the start and end of the sessions. Shortcuts are also provided here allowing you to select predefined and common ranges.

Finally, regarding organisation and system properties, these each present an Add button that, once clicked, will display a list of the available properties, a field or selection list to provide the filter value, and controls to confirm or cancel the filter. Multiple property filters can be added with the following semantics:
Values provided for the same property are applied using “OR” logic.
Values provided for different properties are applied using “AND” logic.
The presented sessions are automatically updated whenever your filter options are modified, or when the filters are removed altogether by clicking the Clear filters button. The filter panel may also be collapsed and expanded by clicking the panel’s title while maintaining the defined filters. The Refresh button is used to refresh the display of results based on the current filtering.
View test session details
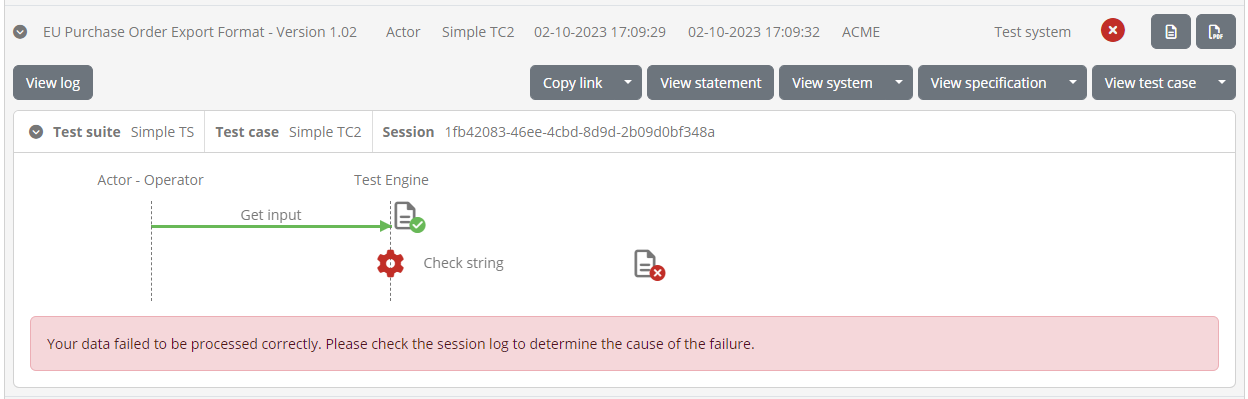
Each row from the lists of presented test sessions may also be clicked to view its details. Doing so expands the row to present a diagram that is identical to the one presented during the live test execution (see Interactive execution).
Once one or more test session rows have been expanded the relevant table’s header will also include a Collapse all button that can be clicked to collapse all expanded rows.
The diagram’s header includes additional information on the test session, and specifically its test suite, test case and session identifier, the latter of which can be clicked to copy it to the clipboard. Furthermore, clicking elsewhere on the header of the diagram display will collapse (or expand) the diagram, which could be useful if you want to quickly view other information on the screen.
Above the diagram display you are presented with additional buttons linked to the test session. The purpose of these are as follows:
View log opens up the test session log for display, displaying its contents similarly to when the session is executing.
Copy link copies a shareable link for the current session that can be used to directly navigate to its detailed display. You also have an option termed Copy link for organisation that will generate a shareable link to the test session in the relevant organisation’s session history, for use by the organisation’s users.
View statement takes you to the relevant conformance statement’s details. This has further options for further navigation, to view the relevant system, organisation, community, actor, specification, domain, test case and test suite.
In the case of an active test session you are also provided with a button to refresh its display and view pending interactions (in case interactions are pending).

Refreshing the display allows you to track the progress of a specific test session without needing to make a full refresh of the displayed results. Clicking this button will refresh only the relevant test session and reflect changes on its diagram. Note that it is possible that upon refresh, the test session has in the meanwhile completed, in which case a relevant information popup will inform you accordingly. In case of a pending interaction, clicking to view it will present it so that it can be completed and allow the session to proceed. This allows you to have test sessions execute in the background while checking through this screen on whether they need user interactions.
Clicking on the session row will once again collapse the display. Note that once one or more session details are expanded the table’s header will display a Collapse all button that can be clicked to collapse all details.
View test step details
Clicking on a step’s document icon triggers a popup that shows the step’s different information elements that can be viewed inline or opened in a separate popup editor. In the case of validation steps, this is extended to also provide the detailed validation results as illustrated in the following example for a validation failure.

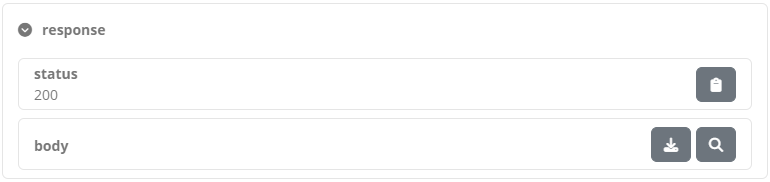
In the test step result popup you are presented with the result and completion time as the step summary. In the sections that follow you can inspect the output information from the step, presented either inline (for short values), as a file you can download, or through a further popup editor. In the latter case this is triggered by clicking the View button. Clicking to open this, displays its content which, in the case of validation steps, is also highlighted for the recorded validation messages.
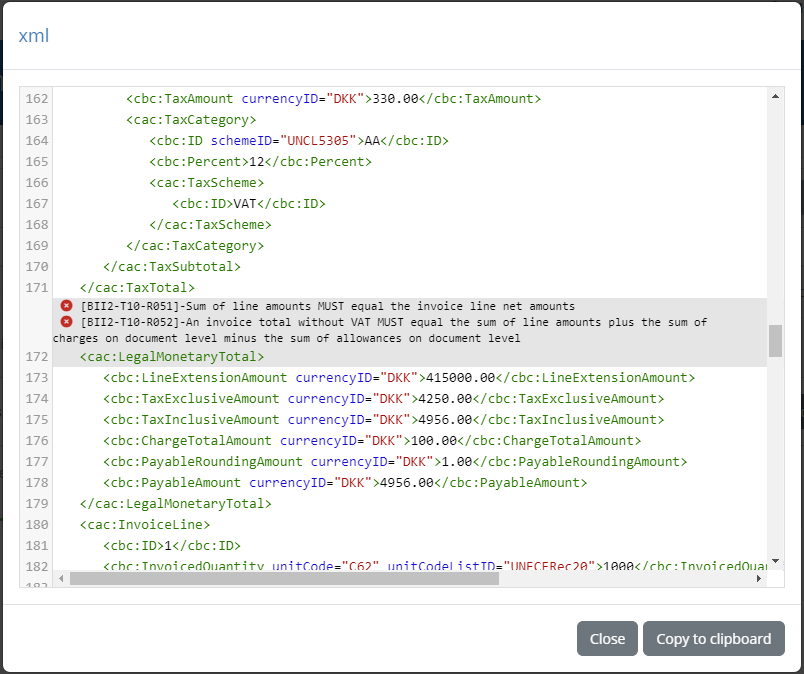
The editor popup allows you to copy a specific part of the content or, by means of the Copy to clipboard button, copy its entire contents. The Close button closes this popup and returns you to the test step result display. Note that clicking on a specific error will open the validated content and automatically focus on the selected error.
An alternative to viewing the content in this way is to click the Download button which will download the content as a file. The Test Bed will determine the most appropriate type for the content and name the downloaded file accordingly (if possible). In the case of simple texts that are presented inline, you are not presented with the download and view buttons, but rather with a Copy to clipboard button that allows you to copy the presented value.
Note
Viewing binary output: Images are presented as a preview when selecting to view them. For other binary content (e.g. a PDF document), the best way to inspect it is to download it. Opening such content in the in-place code editor will still be possible, but this will most likely not be useful.
Export test step report
The results of the test step can also be exported as a test step report in PDF and XML formats. This is made available through the Download report button for PDF, and its Download report as XML additional option for XML, that will trigger the generation and download of the report in the requested format. The following example represents such a report in PDF.
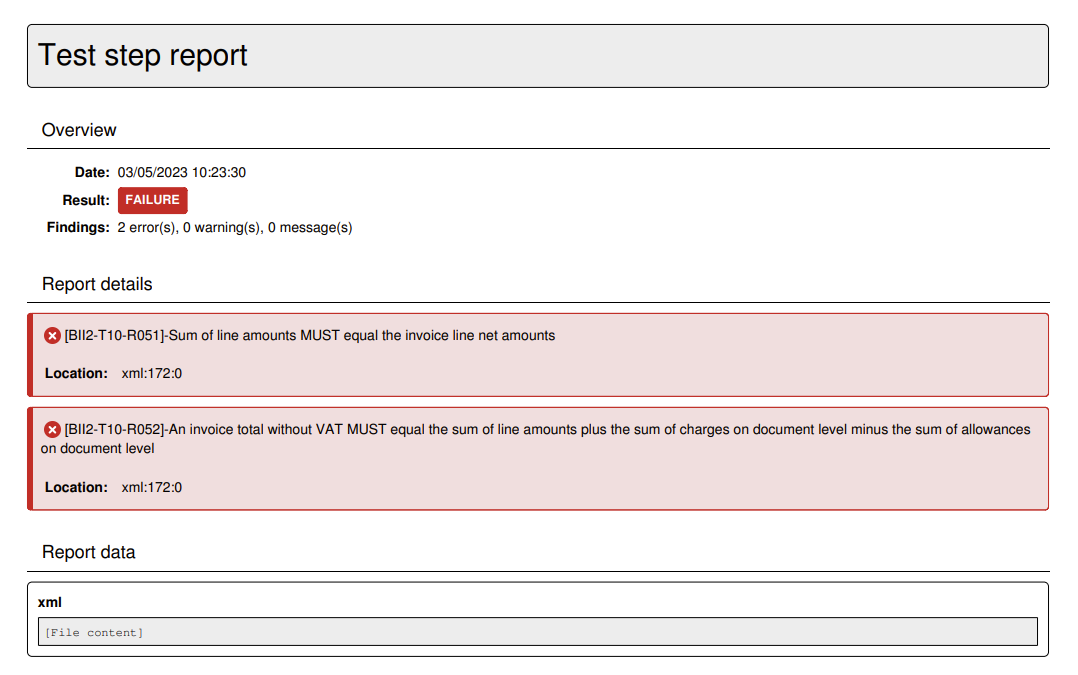
This PDF report includes:
The test step result overview, including the result, date and, in case of a validation step, the total number of validation findings (classified as errors, warnings and messages).
The report details, included in case of a validation step to list the details of the validation report’s findings.
When selecting to download the report as XML, you receive similar information but represented in XML for simpler machine-processing. The structure of the report is defined by the GITB Test Reporting Language (GITB TRL), with the following being a simple sample:
<?xml version="1.0" encoding="UTF-8" standalone="yes"?>
<TestStepReport xmlns="http://www.gitb.com/tr/v1/" xmlns:ns2="http://www.gitb.com/core/v1/" xmlns:ns3="http://www.gitb.com/tbs/v1/" xmlns:xsi="http://www.w3.org/2001/XMLSchema-instance" xsi:type="TAR" name="Schematron Validation" id="4">
    <date>2022-10-14T15:21:30.250+02:00</date>
    <result>FAILURE</result>
    <counters>
        <nrOfAssertions>0</nrOfAssertions>
        <nrOfErrors>2</nrOfErrors>
        <nrOfWarnings>0</nrOfWarnings>
    </counters>
    <reports>
        <error xsi:type="BAR">
            <description>[BII2-T10-R051]-Sum of line amounts MUST equal the invoice line net amounts</description>
            <location>xml:172:0</location>
        </error>
        <error xsi:type="BAR">
            <description>[BII2-T10-R052]-An invoice total without VAT MUST equal the sum of line amounts plus the sum of charges on document level minus the sum of allowances on document level</description>
            <location>xml:172:0</location>
        </error>
    </reports>
</TestStepReport>
Note
You can also define custom formats for any kind of XML report. This is managed as part of the community’s report settings.
Export all test sessions
Both lists of active and completed test sessions can be exported in CSV format. This is done by clicking the Export CSV button from the respective table’s header.
Doing so will generate a CSV file taking into account the currently applied filtering settings. If you have defined custom properties for the community applicable to organisations or systems (see Edit custom member properties) these may also be included in these CSV exports. To include a custom property:
It must be a Simple text value (i.e. not a hidden value or a file).
It must be configured as Included in exports.
All such properties are included in the export as columns following the “Organisation” or “System”, depending on whether they are organisation of system level properties. Their columns are named using a prefix of “Organisation” or “System” followed by the property’s key value included in parentheses.
