Execute tests
Executing conformance tests for your system is the reason you are using the Test Bed. Considering that test cases are linked to your system by means of conformance statements, the first step before executing a test is to visit a conformance statement’s detail screen. This screen is the place where you input required configuration and are provided with the controls to execute one or more tests.
Provide your system’s configuration
The testing configuration for your selected specification may require that you provide one or more configuration parameters before executing tests. If for example test cases require that the Test Bed sends messages to your system, it is likely that you need to inform the Test Bed on how to do so.
Providing and reviewing the configuration for your system is done through the Configuration parameters tab of the conformance statement detail page. In addition, you may need to provide inputs for mandatory organisation-level and system-level properties that apply to your organisation.
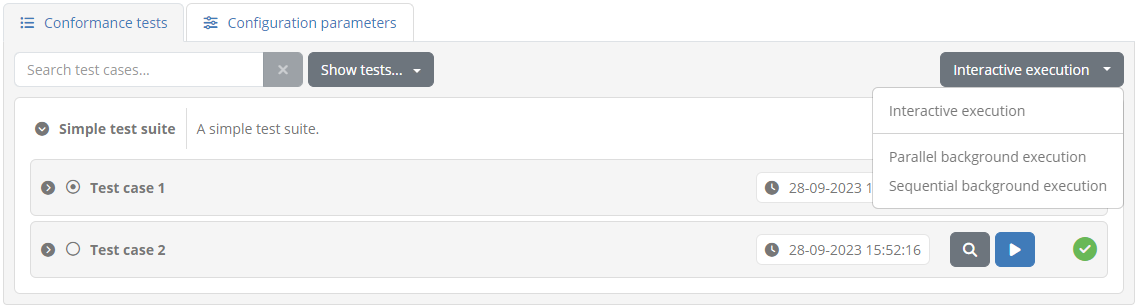
Once all required configuration is provided you can choose to execute one or more test cases through the conformance statement details’ Conformance tests tab. The test execution process starts by clicking one of the available Play buttons. In short, you can either execute a specific test case or a complete test suite and choose whether the test sessions will be launched in the background or in interactive mode (the default). Furthermore, for background test sessions you may choose whether these will be executed in parallel or sequentially.
Regardless of how test sessions are to be launched, if required configuration is missing you will be presented with a popup listing the missing information, split per type:
Organisation properties: Properties at the level of the whole organisation.
System properties: Properties at the level of the system being tested.
Conformance statement parameters: Configuration parameters linked to the specific conformance statement.
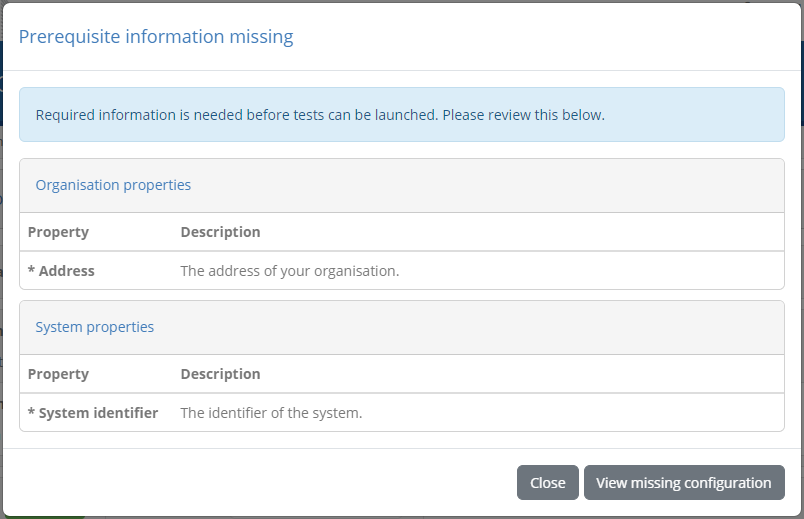
In each case you see the name and description of the missing property. Clicking Close will close the popup, whereas clicking View missing configuration will take you to the Configuration parameters tab.
Background execution
Launching tests in the background is done by selecting one of the background execution options from the Conformance tests tab (“parallel” or “sequential”).
With this set you click the Play button to launch all tests, a full test suite, a specific test case, or a currently filtered set of test cases. Doing so will launch the test sessions in the background presenting a brief visual confirmation in the top right area of the screen.

The status of test sessions launched in the background can be monitored by means of the test history screen.
Interactive execution
Launching tests interactively is the default option and is enabled by setting the execution mode dropdown menu to Interactive execution.
With this set you click the Play button to launch all tests, a full test suite, a specific test case, or a currently filtered set of test cases. Doing so will display the list of test cases you have selected for execution:
The presented display includes on top a set of controls to manage your tests and control their execution. Specifically:
The Go to conformance statement button allows you to return at any time to the conformance statement detail screen. In case you click this when test sessions have already started executing they will continue to run in the background.
Through the Options button you can adapt the way test sessions are displayed. By default completed tests are hidden and pending tests are displayed to have the active session always on top. You can however adapt these settings to e.g. view an already executed test or hide upcoming ones.
Similarly through the Options button you can select how execution continues once a test session completes. By default the next test session will start automatically but you can choose to have execution pause whenever a test completes.
Note
Executing a single test case: In case you have chosen to execute only a single test case the options managing the display of test sessions and the execution of further test cases are not presented.
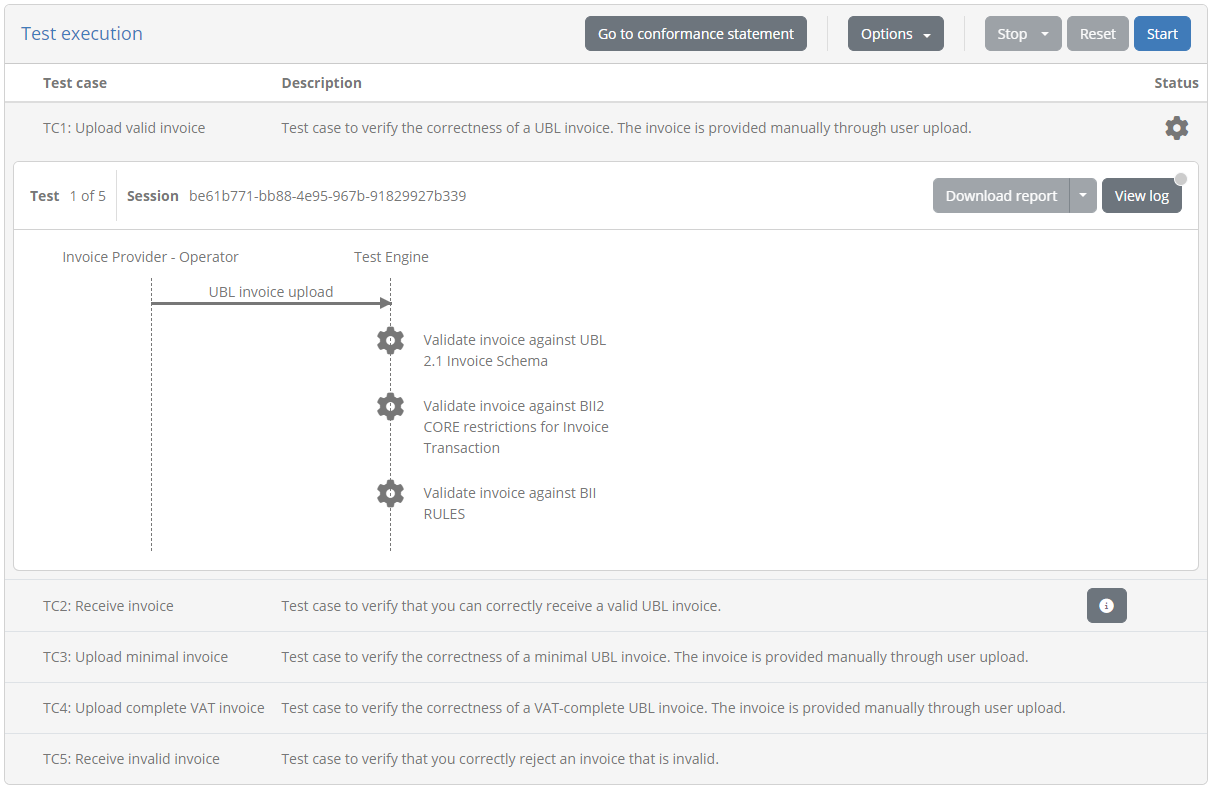
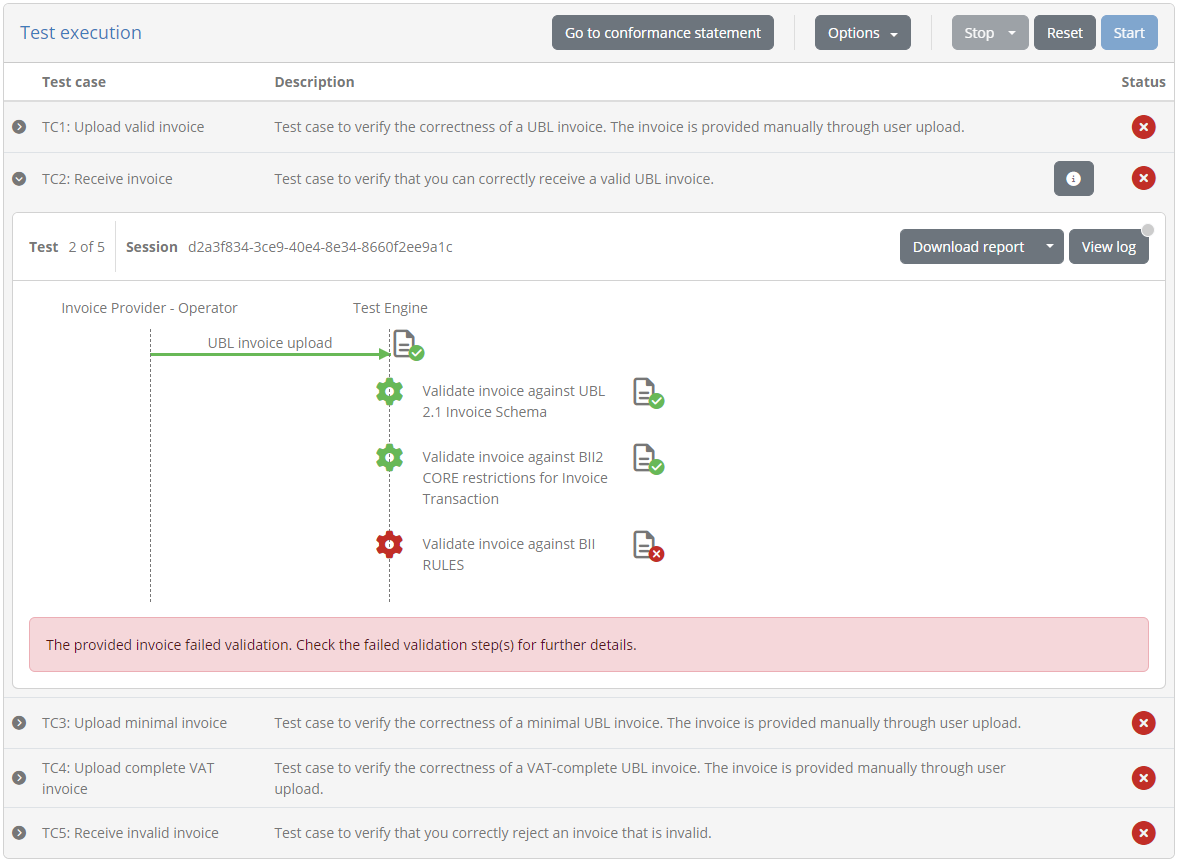
Beneath these controls, you can see the list of test cases to execute. For each test case you can see its name, description as well as its current status (ready, ongoing, failed or succeeded). In case the test case has extended documentation, an additional information button is presented that can be clicked to present it in a popup:
For the currently active test case you see an additional panel that presents to you the test diagram, the test counter (if executing multiple test cases) and the test session identifier (which can be clicked to copy). The View log button on the right can be used to view and follow the test session’s log (see View test session log).
Once all configuration has been prepared and the current test case’s definition has been loaded you will be able to proceed with the test execution. You can do this by clicking the Start button from the test execution controls.

Test execution
To start executing your selected tests click the Start button from the test execution controls.
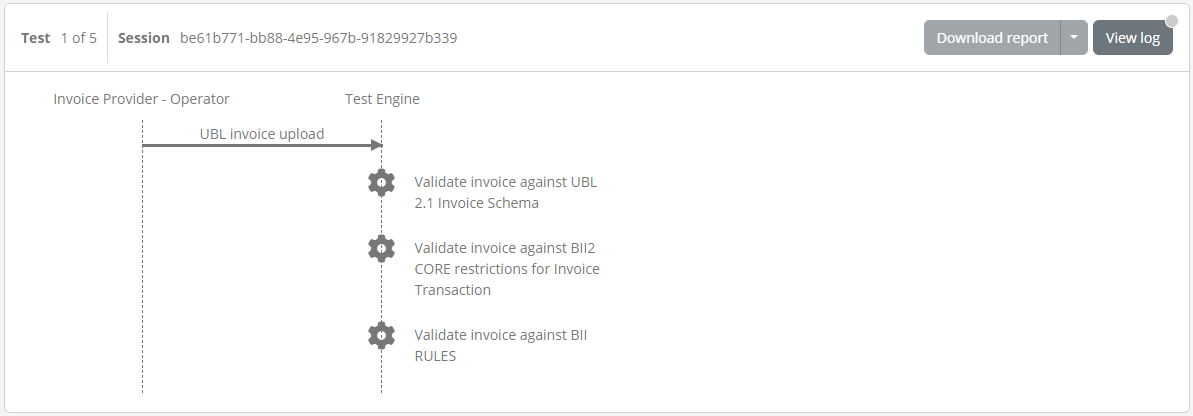
Test execution goes through the steps defined in the test case’s definition which are presented in a way similar to a sequence diagram. The elements included in this diagram are:
A lifeline per actor defined in the test case. One of these will be marked as the “SUT” (the System Under Test), whereas the other actor lifelines will be simulated. An additional user lifeline may also be present in case user interaction is defined in the test case.
Expected messages between actors represented as labelled arrows indicating the type and direction of the communication.
A Test Engine lifeline in case the test case includes validation or processing steps that are carried out by the test bed that don’t relate to a specific actor.
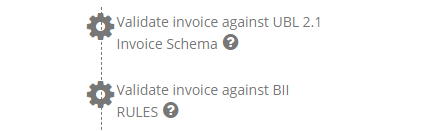
Zero or more cog icons, typically under the “Test Engine” indicating the points where validation or processing will take place.
Visual grouping elements that serve to facilitate the display in case of e.g. conditional steps, parallel steps or loops.
Monitor and manage test progress
Clicking the Start button begins the first selected test case’s session. What follows depends on the definition of the test case as illustrated in the presented diagram but can be summarised in the following types of feedback:
Exchanges of messages between actors (i.e. the displayed arrows) proceed. Messaging initiated by the Test Bed happens automatically, whereas for messages originating from your system the test session blocks until you trigger them, e.g. through your system’s user interface.
Popup dialogs relative to interaction steps are presented to either inform you or request input.
Validation or processing steps take place automatically.
During the execution of the test case, colours are used to inform you of each step’s status:
Blue is used to highlight the currently active or pending step. This could be a blue arrow showing that a message is expected or a spinning blue cog to show active processing.
Grey is used for all elements that haven’t started yet or that have been skipped (e.g. due to conditional logic). Skipped steps are also displayed with a strike-through to enhance the fact they have been skipped.
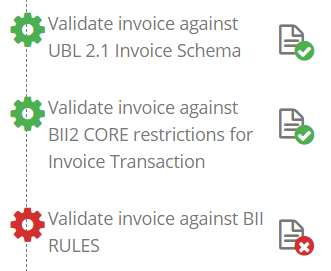
Green is used for steps that have successfully completed.
Red is used for steps that have failed with a severity level of “error”.
Orange is used for steps that have failed with a severity level of “warning”.
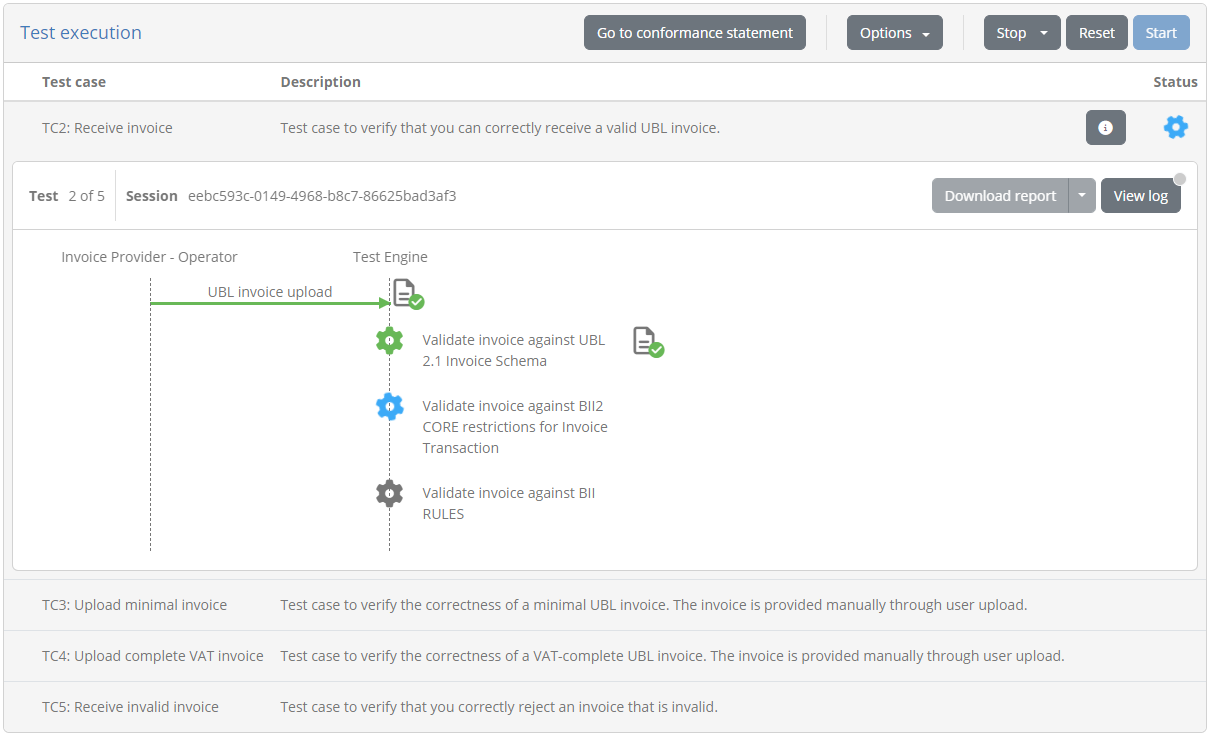
The colour-based feedback is also repeated at the level of the test case overview in the status cog icons. The icon’s colour serves to highlight the currently active test case, versus future ones or completed ones (in case these are displayed). Once completed, the status icon for the test case is replaced by a green tick or red cross to indicate the session’s overall result as a success or failure respectively. Note that a test session is considered as failed if it contains at least one error; warnings are displayed but don’t affect the overall test outcome (i.e. in the presence of warnings and no errors the overall test result will be successful).
During a test you may be prompted with certain information or be requested for inputs. When this occurs you will see a user interaction popup with information and inputs depending on the specific test step.
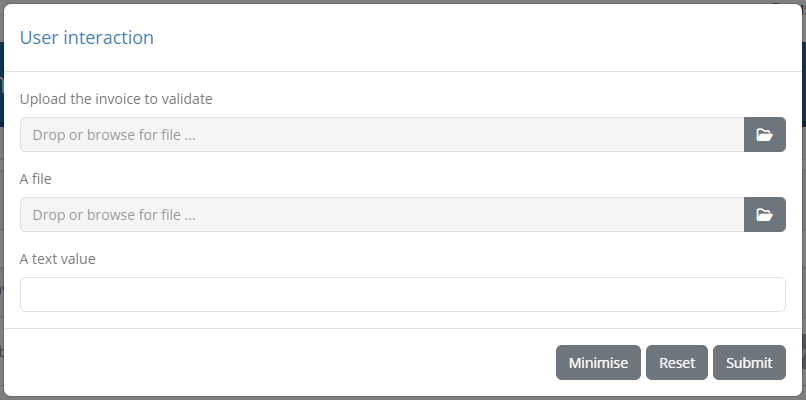
Such prompts allow you to inspect the information provided (for example a simple text value, a file, an image) with controls to copy, open in an editor, preview or download as applicable. Input controls on the other hand vary depending on the information requested, ranging from file upload and text inputs to code editors. Information-only pop-ups can be closed, whereas when inputs are requested you are able to reset and submit your data. In addition, you may minimise the prompt to inspect other information such as previous test step reports. If user prompts are minimised you will see a a View pending interaction button, that can be clicked to restore the popup.

Note
User interactions can also be completed asynchronously by inspecting your currently active test sessions.
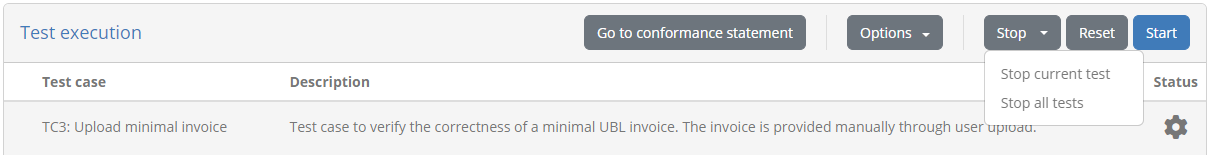
In case multiple test cases are up for execution, testing proceeds automatically unless you have chosen to continue manually. In such a case you will need to click againt the Start button to proceed. Stopping the test(s) execution is achieved by clicking the Stop button from the test execution controls. In case you are executing multiple test cases this offers two options, stopping only the current test or all test cases.
During test case execution (or when tests are no longer running) the Reset button will also be enabled. This serves as shortcut to stop any ongoing tests and re-run them.
View test step documentation
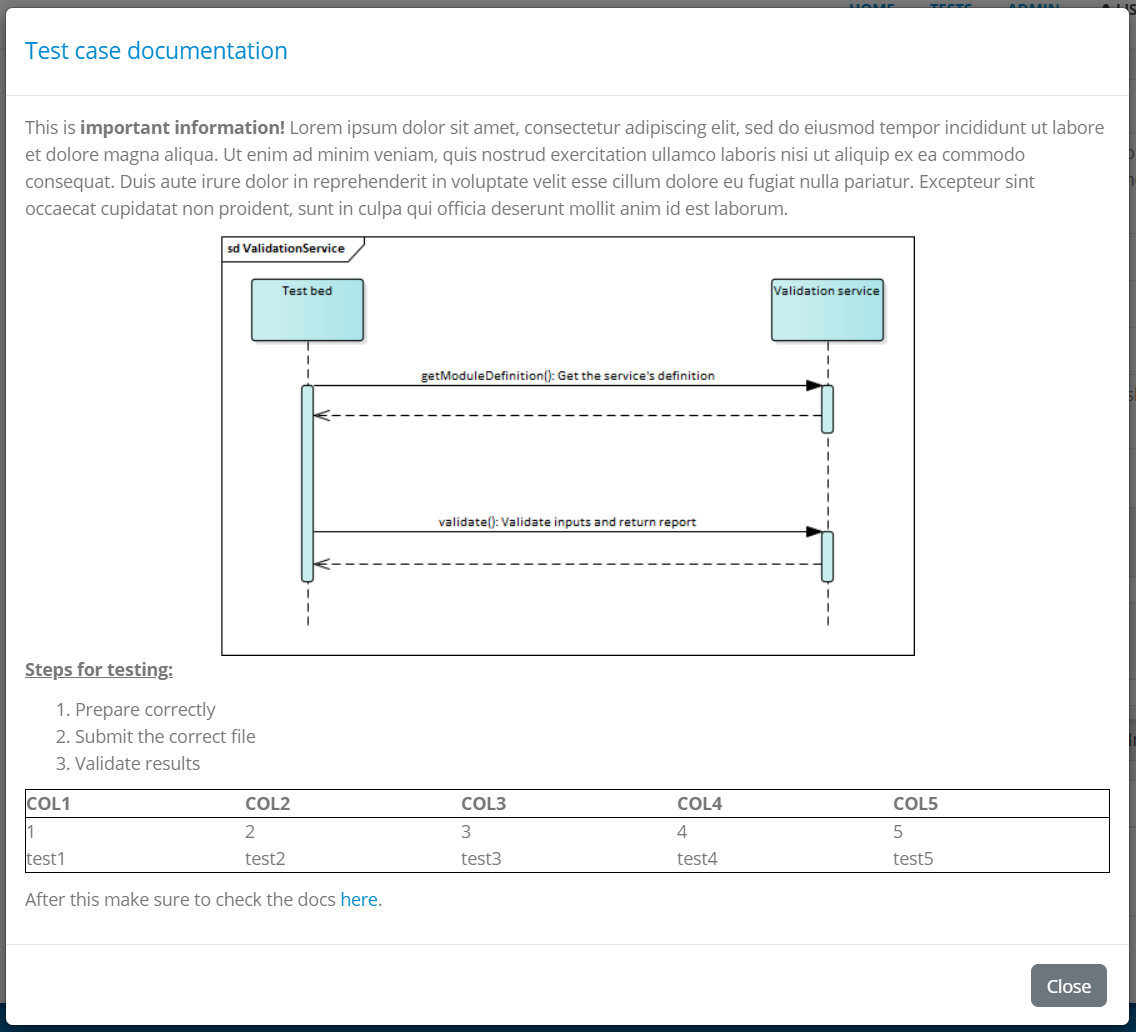
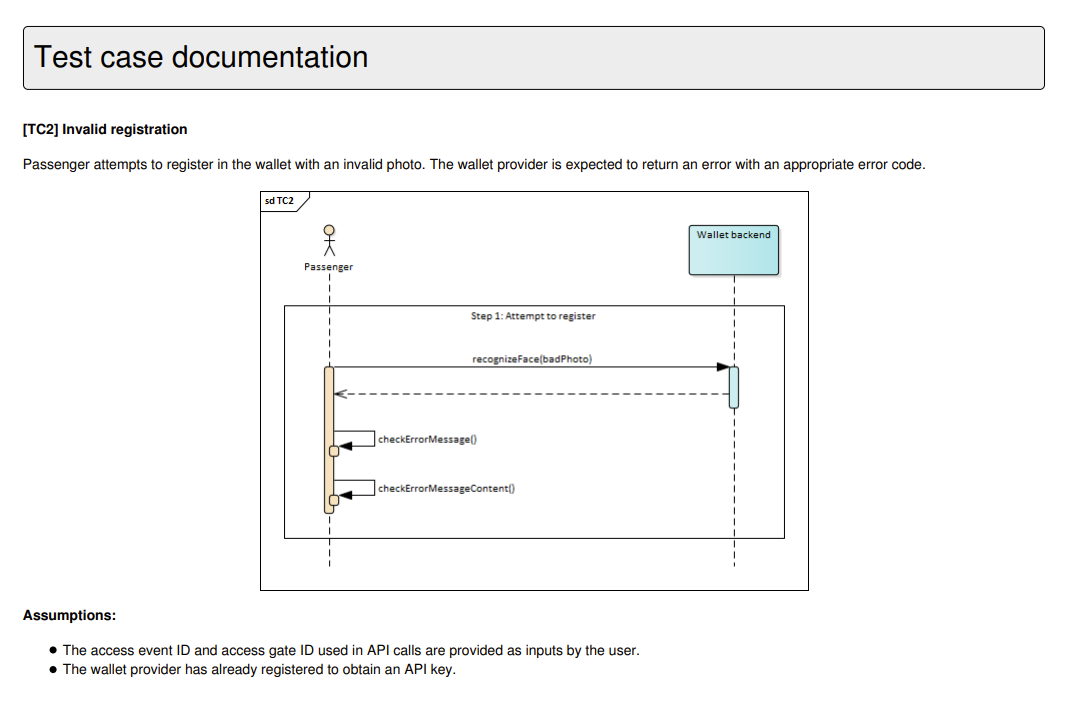
Test steps are presented in the test execution diagram with a limited description label. Test steps can however be defined to also include additional detailed context, documentation, or instructions. Test steps defining such additional documentation are presented with a circled question mark next to their label that can be clicked.
Clicking the presented icon results in a “Step information” popup that displays the further documentation linked to the step. This can range from being a simple text to rich text documentation, including styled content, tables, lists, links and images.
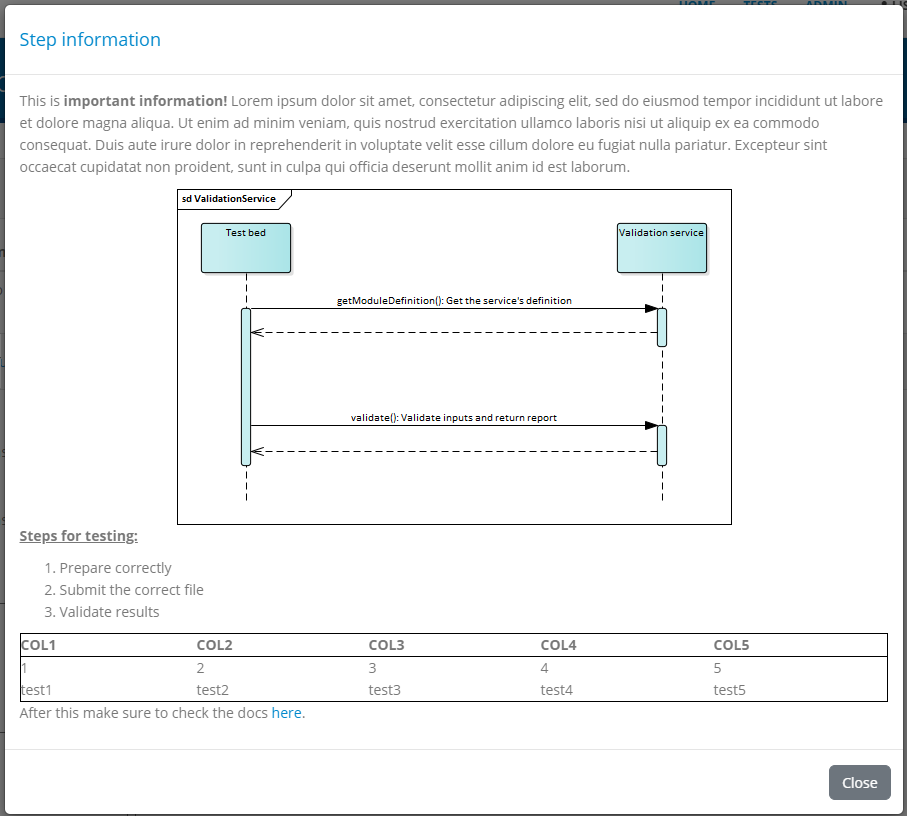
Clicking the Close button or anywhere outside the popup will dismiss it and refocus the test execution diagram.
View test step results
During test case execution, additional controls are made available to allow you to inspect the ongoing test(s) results.
First of all, if multiple test cases are selected for execution, completed test case sessions can be inspected by clicking Options, selecting to show completed tests and clicking their relevant row. Doing so will expand the clicked row to display the relevant test execution diagram.
Regarding the test steps within a given test session, each completed step is a displayed with a status icon that highlights on hover (green for success, orange for warning or red for failure). This applies for validation, messaging, processing and interaction steps.
Apart from serving as an additional indication on the success or failure of the test step, these controls provide further details on the step’s results. Clicking them triggers a popup that shows the different information elements that can be viewed inline or opened in a separate popup editor. In the case of validation steps, this is extended to also provide the detailed validation results and an overview of the error, warning and information message counts, as illustrated in the following example. The different severity indicators can be toggled to show or hide the related items.
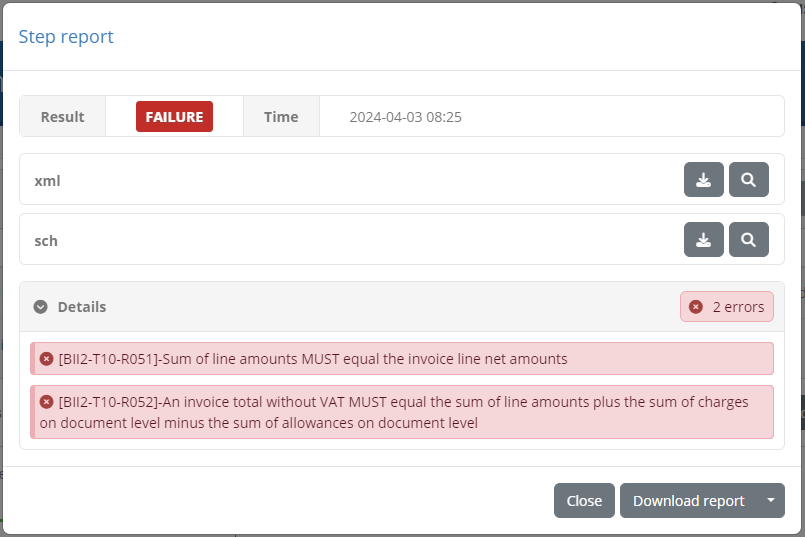
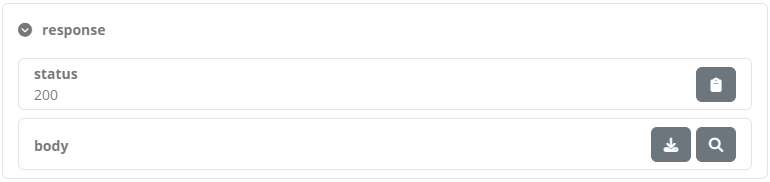
In the test step result popup you are presented with the result and completion time as the step summary. In the sections that follow you can inspect the output information from the step, presented either inline (for short values), as a file you can download, or through a further popup editor. These two latter options are available by clicking the download or view icons respectively at the right of each section. In case you choose to view the content in an editor, a popup is presented that displays the content which, in the case of validation steps, is also highlighted for the recorded validation messages.
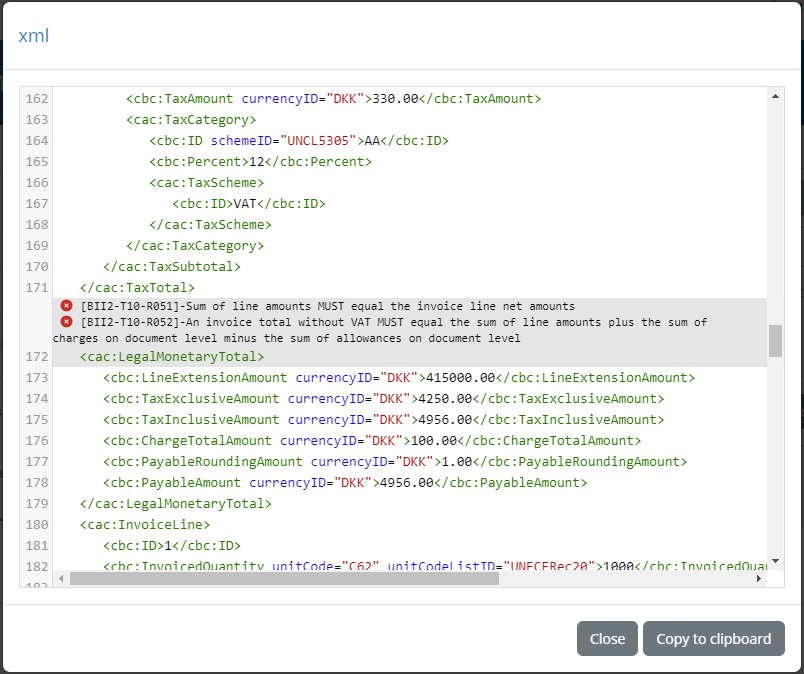
The editor popup allows you to copy a specific part of the content or, by means of the Copy to clipboard button, copy its entire contents. The Close button closes this popup and returns you to the test step result display. Note that clicking on a specific error will open the validated content and automatically focus on the selected error.
An alternative to viewing the content in this way is to click the Download button which will download the content as a file. The Test Bed will determine the most appropriate type for the content and name the downloaded file accordingly (if possible). In the case of simple texts that are presented inline, you are not presented with the download and view buttons, but rather with a Copy to clipboard button that allows you to copy the presented value.
Note
Viewing binary output: Images are presented as a preview when selecting to view them. For other binary content (e.g. a PDF document), the best way to inspect it is to download it. Opening such content in the in-place code editor will still be possible, but this will most likely not be useful.
The errors, warnings and information messages displayed are contained in a details section that also shows the overall counts per violation severity level. This summary title is also clickable, to allow the listed details to be collapsed or expanded if already collapsed. Collapsing the displayed details could be useful in case they are numerous, providing as such easier access to the popup’s additional controls.
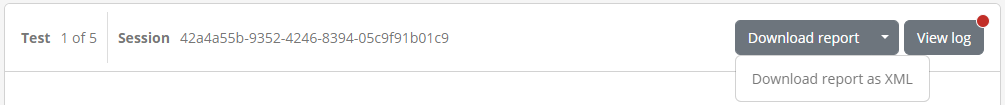
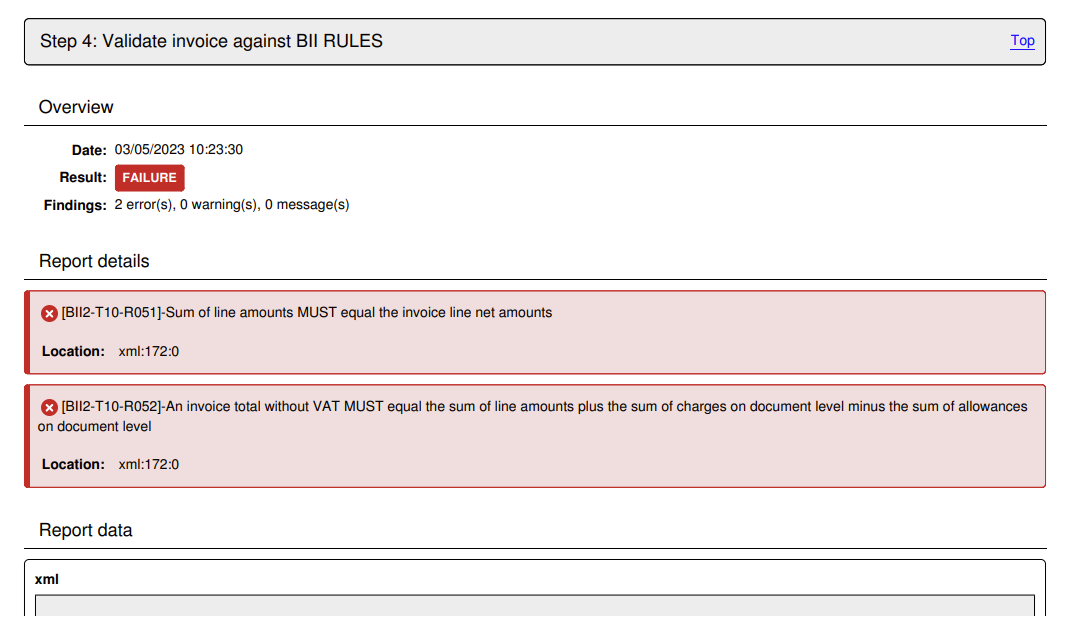
The results of the test step can also be exported as a test step report (in PDF and XML format). This is made available through the Download report button and its additional Download report as XML option, that trigger the generation and download of the step report in the desired format. The following example presents such a report in PDF.
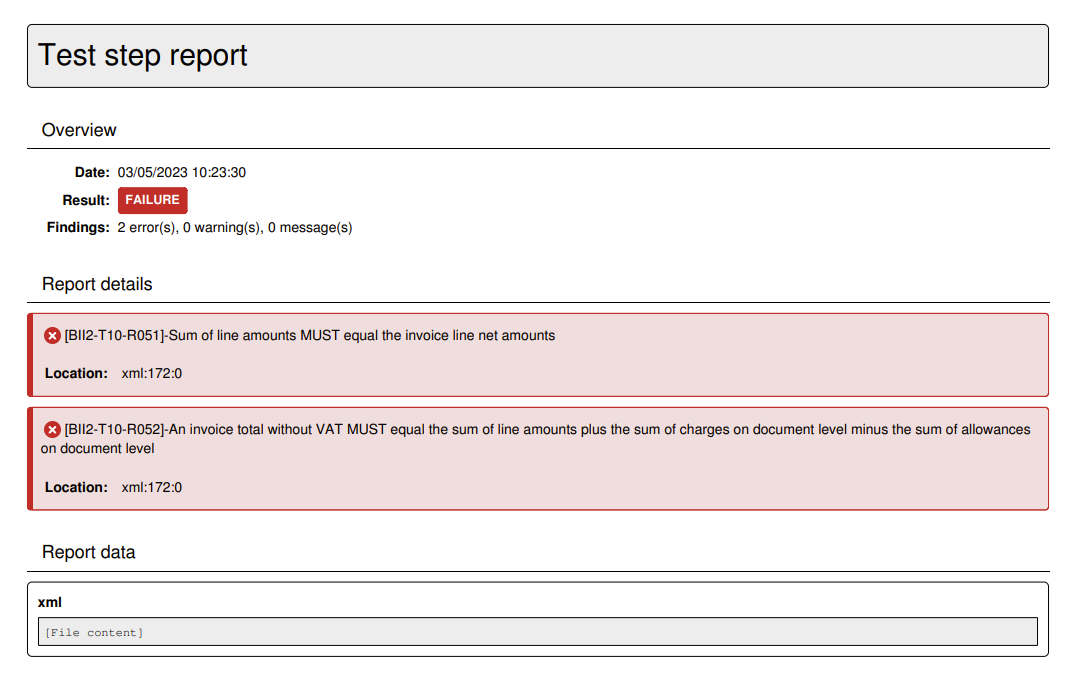
The PDF report includes:
The test step result overview, including the result, date and, in case of a validation step, the total number of validation findings (classified as errors, warnings and messages).
The report details, included in case of a validation step to list the details of the validation report’s findings.
The report data matching the step’s input and output data. Note that only text values are presented in full and are truncated if too long.
When selecting to download the report as XML, you receive similar information but represented in XML for simpler machine-processing. The structure of the report is defined by the GITB Test Reporting Language (GITB TRL), with the following being a simple sample:
<?xml version="1.0" encoding="UTF-8" standalone="yes"?>
<TestStepReport xmlns="http://www.gitb.com/tr/v1/" xmlns:ns2="http://www.gitb.com/core/v1/" xmlns:ns3="http://www.gitb.com/tbs/v1/" xmlns:xsi="http://www.w3.org/2001/XMLSchema-instance" xsi:type="TAR" name="Schematron Validation" id="4">
    <date>2022-10-14T15:21:30.250+02:00</date>
    <result>FAILURE</result>
    <counters>
        <nrOfAssertions>0</nrOfAssertions>
        <nrOfErrors>2</nrOfErrors>
        <nrOfWarnings>0</nrOfWarnings>
    </counters>
    <reports>
        <error xsi:type="BAR">
            <description>[BII2-T10-R051]-Sum of line amounts MUST equal the invoice line net amounts</description>
            <location>xml:172:0</location>
        </error>
        <error xsi:type="BAR">
            <description>[BII2-T10-R052]-An invoice total without VAT MUST equal the sum of line amounts plus the sum of charges on document level minus the sum of allowances on document level</description>
            <location>xml:172:0</location>
        </error>
    </reports>
</TestStepReport>
Finally, it is important to point out that the examination of a test session’s result, both in terms of steps and message exchanges, as well as detailed test step results, is possible at any time through your test session history (see View your test history).
View test session log
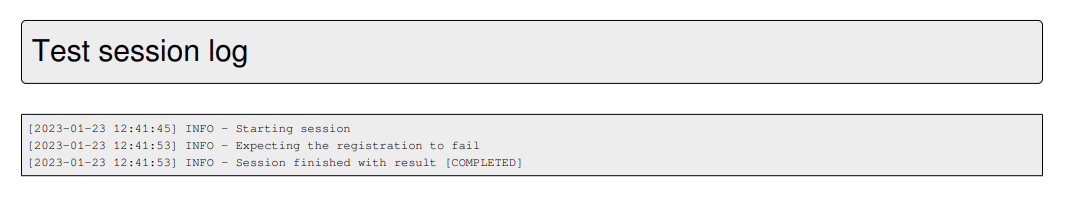
During any point in a test session’s execution, be it an active or completed test session, you may view its detailed log output. This is done by clicking the View log button in the top right corner of the test execution diagram. This button displays also a status indicator as a circle in case the log includes new messages since the last time it was viewed. Furthermore, this indicator will be orange or red in case the log includes respectively warnings or errors.
Clicking this button will open a popup window that includes the detailed log output (debug statements, information messages, warnings and errors) for your test session.
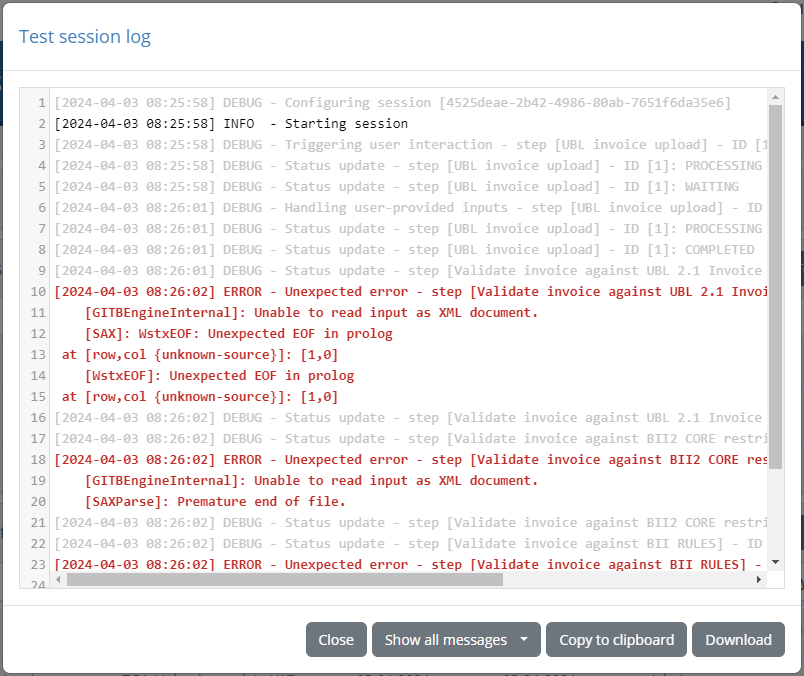
The detailed log output is typically very useful when you receive error messages but for which the description provided is not clear. The log output may be used in such a case to determine the cause of the problem or, for unexpected issues, provide input to the Test Bed support team (see Contact support). Note that once opened, the log display is automatically updated for newly received messages.
The displayed log messages are highlighted with different colours depending on their severity:
Light grey for debug messages.
Black for information messages.
Orange for warnings.
Red for errors.
Finally, the popup’s includes controls to manage the log display. Specifically you may:
Choose to automatically follow the latest messages (i.e. tail) or maintain your scroll position.
Select the minimum severity to display (by default all messages are displayed).
Copy the log to your clipboard.
Download the log as a text file.
Close the popup.
Export test session report
Once a test session has completed it is also possible to export its report in PDF or XML, using the Export report as PDF and Export report as XML buttons respectively.
The XML export format of this report is defined by the GITB Test Reporting Language (GITB TRL), and is suitable for machine-based processing. The following XML content is a sample of such a report:
<?xml version="1.0" encoding="UTF-8" standalone="yes"?>
<TestCaseOverviewReport xmlns="http://www.gitb.com/tr/v1/" xmlns:ns2="http://www.gitb.com/core/v1/" xmlns:ns3="http://www.gitb.com/tbs/v1/" id="UBL_invoice_validation_test_3">
    <metadata>
        <ns2:name>TC3: Upload minimal invoice</ns2:name>
        <ns2:description>Test case to verify the correctness of a minimal UBL invoice. The invoice is provided manually through user upload.</ns2:description>
    </metadata>
    <sessionId>6f7df938-8478-49ea-9626-97ba5d611f0e</sessionId>
    <startTime>2022-10-14T15:21:14.000+02:00</startTime>
    <endTime>2022-10-14T15:21:31.000+02:00</endTime>
    <result>FAILURE</result>
    <message>The provided invoice failed validation. Check the failed validation step(s) for further details.</message>
    <steps>
        <step id="1">
            <description>Step 1: UBL invoice upload</description>
            <report xmlns:xsi="http://www.w3.org/2001/XMLSchema-instance" xsi:type="TAR" id="1">
                <date>2022-10-14T15:21:25.767+02:00</date>
                <result>SUCCESS</result>
            </report>
        </step>
        <step id="2">
            <description>Step 2: Validate invoice against UBL 2.1 Invoice Schema</description>
            <report xmlns:xsi="http://www.w3.org/2001/XMLSchema-instance" xsi:type="TAR" name="XML Schema Validation" id="2">
                <date>2022-10-14T15:21:25.853+02:00</date>
                <result>SUCCESS</result>
                <counters>
                    <nrOfAssertions>0</nrOfAssertions>
                    <nrOfErrors>0</nrOfErrors>
                    <nrOfWarnings>0</nrOfWarnings>
                </counters>
                <reports/>
            </report>
        </step>
        <step id="3">
            <description>Step 3: Validate invoice against BII2 CORE restrictions for Invoice Transaction</description>
            <report xmlns:xsi="http://www.w3.org/2001/XMLSchema-instance" xsi:type="TAR" name="Schematron Validation" id="3">
                <date>2022-10-14T15:21:29.756+02:00</date>
                <result>SUCCESS</result>
                <counters>
                    <nrOfAssertions>0</nrOfAssertions>
                    <nrOfErrors>0</nrOfErrors>
                    <nrOfWarnings>1</nrOfWarnings>
                </counters>
                <reports>
                    <warning xsi:type="BAR">
                        <description>Attribute '@listID' marked as not used in the given context.</description>
                        <location>xml:12:0</location>
                    </warning>
                </reports>
            </report>
        </step>
        <step id="4">
            <description>Step 4: Validate invoice against BII RULES</description>
            <report xmlns:xsi="http://www.w3.org/2001/XMLSchema-instance" xsi:type="TAR" name="Schematron Validation" id="4">
                <date>2022-10-14T15:21:30.250+02:00</date>
                <result>FAILURE</result>
                <counters>
                    <nrOfAssertions>0</nrOfAssertions>
                    <nrOfErrors>2</nrOfErrors>
                    <nrOfWarnings>0</nrOfWarnings>
                </counters>
                <reports>
                    <error xsi:type="BAR">
                        <description>[BII2-T10-R051]-Sum of line amounts MUST equal the invoice line net amounts</description>
                        <location>xml:172:0</location>
                    </error>
                    <error xsi:type="BAR">
                        <description>[BII2-T10-R052]-An invoice total without VAT MUST equal the sum of line amounts plus the sum of charges on document level minus the sum of allowances on document level</description>
                        <location>xml:172:0</location>
                    </error>
                </reports>
            </report>
        </step>
    </steps>
</TestCaseOverviewReport>
The report includes the following information:
The identifier, name and description of the test case.
The start, end time and identifier for the session.
The overall result as well as the output message that may have been produced.
The list of step reports that include each step’s identifier, description, timestamp, result and findings (if validations were carried out).
The PDF report includes similar information to its XML counterpart with certain additional context data. The following sample report illustrates the information included:
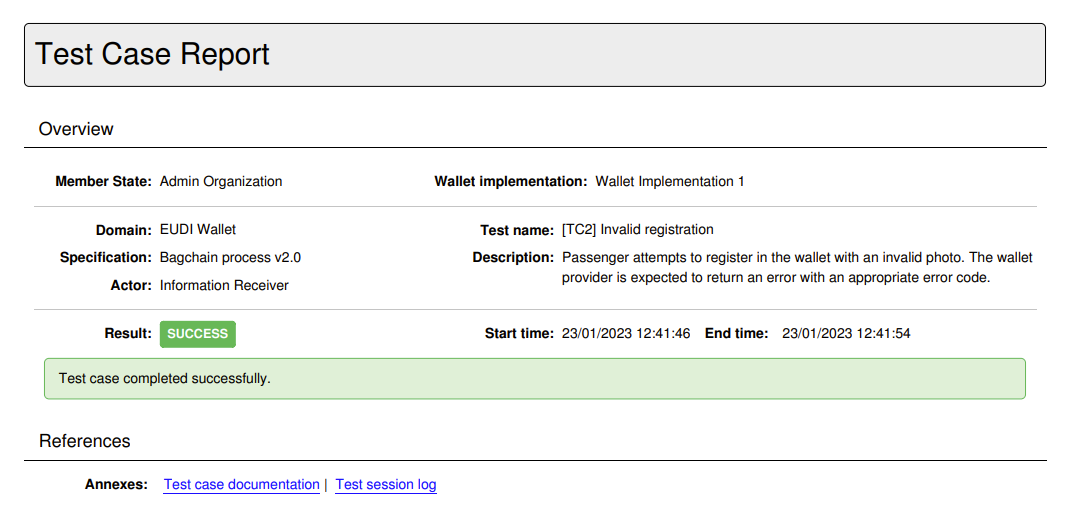
The report contains a first overview section that summarises the purpose and result of the test session. The information included here is:
The name of the system that was tested and the name of its related organisation.
The names of the domain, specification and actor of the relevant conformance statement.
The test case’s name and description.
The session’s result, start and end time.
The session’s output message if one was produced.
Below the overview information follow the test case’s references where, as available, you are provided with links to additional information included as annexes in the report. These may be:
The extended documentation of the test case.
The test session log.
This first page is followed by the section on the test case’s step reports. All steps are initially presented as an overview including per step, its description and result. The detailed step reports follow this overview, with individual reports being directly accessible by clicking each step’s sequence identifier that prefixes its description.
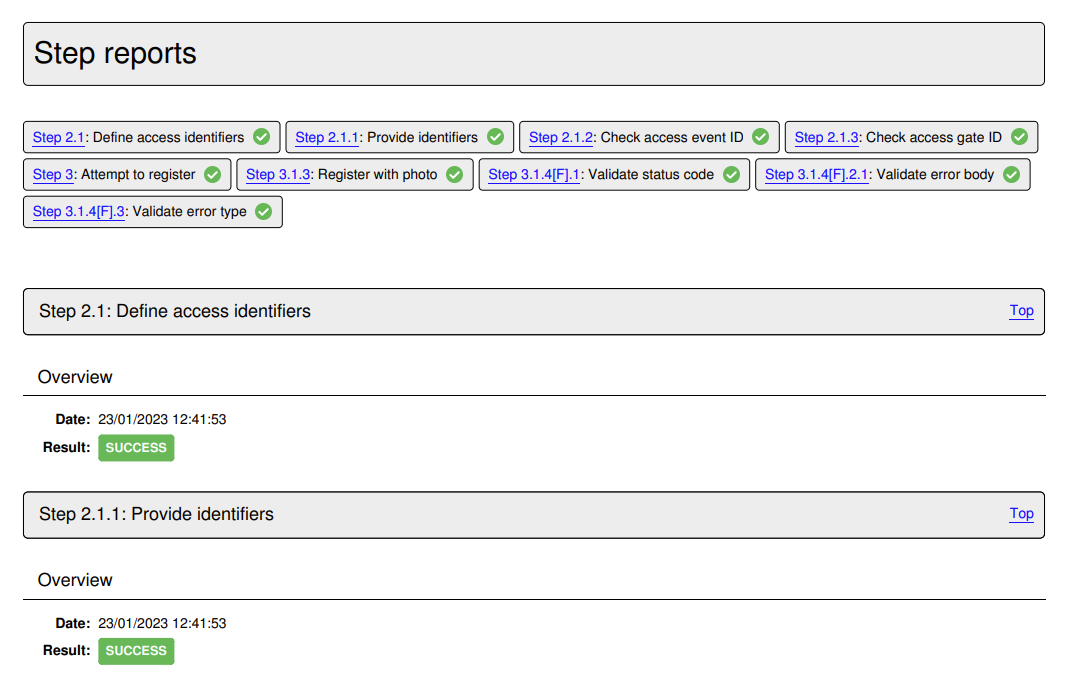
Each detailed step report includes the following information for its step:
Its sequence number and description in its header, that also includes a link to return to the steps’ overview section.
Its result and completion time.
The number of validation report findings classified as errors, warnings and messages (if applicable).
A report details section listing the details of each validation finding (if applicable).
A report data section listing the step’s input and output. Note that only text values are presented here and are truncated if too long.
At the end of the test case report follow the report’s annexes, specifically the test case’s documentation and the produced log output.
Regarding the log output, this is limited to messages reported at information level thus excluding debugging output that could be quite long for elaborate test cases.
Note
The XML report for a given test session can also be obtained through the Test Bed’s REST API (if enabled for your Test Bed instance).
Execution via REST API
Apart from launching tests through its user interface, the Test Bed also provides a REST API allowing you to manage test sessions via REST calls. Specifically you may use the API to:
Start test sessions.
Consult test sessions’ status, logs and reports.
Stop test sessions.
Details on each operation, including sample requests and responses, are provided in the REST API documentation.
Note
The Test Bed’s REST API is an advanced feature that needs to first be enabled by your administrator before it can be used.