View your test history
To view your organisation’s test history click the My test sessions link from the side menu. Doing so presents you with the test session history screen which is split into three main parts:
A set of search filters to help locating specific test results.
The list of active test sessions.
The list of completed test sessions.

Active test sessions
The currently active sessions are those that are pending completion. These could be sessions that are running in the background or sessions that are interactively being executed by other users.

Tests are presented in a paged table sorted based on their start time in a ascending order (i.e. the oldest sessions are presented first). Custom sorting can be applied by clicking the title of each column; clicking a column header for the first time will sort by it in ascending manner and clicking it again will switch to descending. The active sort column and type are indicated using an arrow next to the relevant column header. As is the case with all table displays, you may use controls to go to specific pages as well as the first, previous, next and last ones (as applicable), while showing in the bottom right corner the total and currently displayed test counts. You can also select the number of rows displayed per page, a setting that when changed will also be saved in your user preferences.
Each session is presented on a separate table row, displaying by default per session:
The specification.
The relevant test case.
The relevant system.
The session start time.
These are the default columns; see Adapt the displayed columns for how to adapt them.
The set of currently displayed active sessions can be exported in CSV format by clicking the Export CSV button in the table header (see Export test sessions). You may also click the Terminate all button that, upon confirmation, will forcibly stop all currently active tests. Finally, the header itself can also be clicked to collapse or expand its display.
Regarding individual active test sessions, each session’s row offers controls to:
Forcibly terminate it, by clicking the delete icon on the relevant session’s row.
View its details, by clicking on the row itself (see View test session details).
Completed test sessions
The history of all your completed test sessions is presented in the Completed test sessions table.

Tests are presented in a paged table sorted based on their end time in a descending order (i.e. showing the latest tests at the top). Custom sorting can be applied by clicking the title of each column; clicking a column header for the first time will sort by it in ascending manner and clicking it again will switch to descending. The active sort column and type are indicated using an arrow next to the relevant column header. As is the case with all table displays, you may use controls to go to specific pages as well as the first, previous, next and last ones (as applicable), while showing in the bottom right corner the total and currently displayed test counts. You can also select the number of rows displayed per page, a setting that when changed will also be saved in your user preferences.
Test sessions are displayed one per table row, with each row including by default the following information:
The specification.
The relevant test case.
The relevant system.
The session’s end time.
The test result.
These are the default columns; see Adapt the displayed columns for how to adapt them.
Each row provides a control with further options to export the relevant test case report and to view the test’s steps. In addition, you can use the overall Export CSV button from the table’s header to extract a CSV export of the currently displayed sessions (see Export test sessions). Finally, the header itself can also be clicked to collapse or expand its display.
Note
Obsolete test sessions: One or more test sessions may be rendered obsolete in case of a significant change in the test setup (e.g. the relevant specification being deleted) or a test case update that requires relevant test sessions to be re-executed. Such test sessions remain and can be consulted but are displayed greyed-out to indicate that they are no longer considered towards your overall conformance testing.
Adapt the displayed columns
Both the active and completed test session tables let you choose which columns are displayed. To do so click the Columns button presented in the tables’ paging controls, next to the control to select the number of rows displayed per page.

The available columns are grouped as follows:
What the session concerns: domain, specification and actor, plus test suite and test case.
Who the session concerns: the organisation (when viewing your community’s test history) and the system.
Additional columns: start time (completed sessions table only; always displayed for active sessions) and flag (completed sessions table only, see Flag a test session).
Your selection is applied immediately to the relevant table and is recorded in your user preferences, where it can also be adapted directly. Your community administrator determines the initial default columns for new users.
Apply search filters
To locate specific test sessions you are provided with a set of filter controls at the top of the screen. These are presented initially as collapsed as they are not taken into account, but can be clicked to expand and set specific filter criteria.

The available filters are:
The domain (if applicable), specification group, specification and actor of the sessions’ corresponding conformance statements.
The relevant’ test suite and test case.
The relevant’ system.
The sessions’ result, flag (see Flag a test session) and start time.
A specific session ID.
Whether a comment has been made on the session, optionally matching specific comment text (see Comment on a test session).
All filter controls with the exception of the start time, session ID and comment are multiple selection choices. The session ID is provided through a text field, whereas the start time control is a date picker that allows selection of a range of dates. Shortcuts are also provided here allowing you to select predefined and common ranges. The flag filter, which additionally offers an Unflagged option, and the comment filter are only available if applicable to your community, and both apply to completed test sessions.

Selecting multiple values across these controls are applied as follows:
Within a specific filter control using “OR” logic (e.g. selecting multiple specifications).
Across filter controls using “AND” logic (e.g. selecting a specification and a test case).
Note additionally that selecting dependent values serves to limit the filter options that are presented. For example if a given specification is selected, the test suites and test cases available for filtering will be limited to that specification to already exclude impossible combinations.
The presented tests are automatically updated whenever your filter options are modified, or when the filters are removed altogether by clicking the Clear filters button. It is also possible to collapse the filters without disabling them by clicking on the filter panel header. Note that displaying the performed tests with no filtering is the default when you first visit the screen. Finally, you may also choose to keep the current filtering but refresh the search results by clicking the Refresh button.
Export a test case report
Exporting a test case’s report is possible for completed test sessions, by clicking the option button on the far right side of each test’s row. The presented options allow you to download the test session report in PDF or XML format.

The format of the XML report is defined by the GITB Test Reporting Language (GITB TRL), and is meant for machine-based processing. The following XML content is a sample of such a report:
<?xml version="1.0" encoding="UTF-8" standalone="yes"?>
<TestCaseOverviewReport xmlns="http://www.gitb.com/tr/v1/" xmlns:ns2="http://www.gitb.com/core/v1/" xmlns:ns3="http://www.gitb.com/tbs/v1/" id="UBL_invoice_validation_test_3">
    <metadata>
        <ns2:name>TC3: Upload minimal invoice</ns2:name>
        <ns2:description>Test case to verify the correctness of a minimal UBL invoice. The invoice is provided manually through user upload.</ns2:description>
    </metadata>
    <sessionId>6f7df938-8478-49ea-9626-97ba5d611f0e</sessionId>
    <startTime>2022-10-14T15:21:14.000+02:00</startTime>
    <endTime>2022-10-14T15:21:31.000+02:00</endTime>
    <result>FAILURE</result>
    <message>The provided invoice failed validation. Check the failed validation step(s) for further details.</message>
    <steps>
        <step id="1">
            <description>Step 1: UBL invoice upload</description>
            <report xmlns:xsi="http://www.w3.org/2001/XMLSchema-instance" xsi:type="TAR" id="1">
                <date>2022-10-14T15:21:25.767+02:00</date>
                <result>SUCCESS</result>
            </report>
        </step>
        <step id="2">
            <description>Step 2: Validate invoice against UBL 2.1 Invoice Schema</description>
            <report xmlns:xsi="http://www.w3.org/2001/XMLSchema-instance" xsi:type="TAR" name="XML Schema Validation" id="2">
                <date>2022-10-14T15:21:25.853+02:00</date>
                <result>SUCCESS</result>
                <counters>
                    <nrOfAssertions>0</nrOfAssertions>
                    <nrOfErrors>0</nrOfErrors>
                    <nrOfWarnings>0</nrOfWarnings>
                </counters>
                <reports/>
            </report>
        </step>
        <step id="3">
            <description>Step 3: Validate invoice against BII2 CORE restrictions for Invoice Transaction</description>
            <report xmlns:xsi="http://www.w3.org/2001/XMLSchema-instance" xsi:type="TAR" name="Schematron Validation" id="3">
                <date>2022-10-14T15:21:29.756+02:00</date>
                <result>SUCCESS</result>
                <counters>
                    <nrOfAssertions>0</nrOfAssertions>
                    <nrOfErrors>0</nrOfErrors>
                    <nrOfWarnings>1</nrOfWarnings>
                </counters>
                <reports>
                    <warning xsi:type="BAR">
                        <description>Attribute '@listID' marked as not used in the given context.</description>
                        <location>xml:12:0</location>
                    </warning>
                </reports>
            </report>
        </step>
        <step id="4">
            <description>Step 4: Validate invoice against BII RULES</description>
            <report xmlns:xsi="http://www.w3.org/2001/XMLSchema-instance" xsi:type="TAR" name="Schematron Validation" id="4">
                <date>2022-10-14T15:21:30.250+02:00</date>
                <result>FAILURE</result>
                <counters>
                    <nrOfAssertions>0</nrOfAssertions>
                    <nrOfErrors>2</nrOfErrors>
                    <nrOfWarnings>0</nrOfWarnings>
                </counters>
                <reports>
                    <error xsi:type="BAR">
                        <description>[BII2-T10-R051]-Sum of line amounts MUST equal the invoice line net amounts</description>
                        <location>xml:172:0</location>
                    </error>
                    <error xsi:type="BAR">
                        <description>[BII2-T10-R052]-An invoice total without VAT MUST equal the sum of line amounts plus the sum of charges on document level minus the sum of allowances on document level</description>
                        <location>xml:172:0</location>
                    </error>
                </reports>
            </report>
        </step>
    </steps>
</TestCaseOverviewReport>
The report includes the following information:
The identifier, name and description of the test case.
The start, end time and session identifier.
The overall result as well as the output message that may have been produced.
The list of step reports that include each step’s identifier, description, timestamp, result and findings (if validations were carried out).
The other available report option is the test session’s PDF report.
The PDF report includes similar information to its XML counterpart with certain additional context data. The following sample report illustrates the information included:

The report contains a first overview section that summarises the purpose and result of the test session. The information included here is:
The name of the system that was tested and the name of its related organisation.
The names of the domain, specification and actor of the relevant conformance statement.
The test case’s name and description.
The session’s result, start time, end time and identifier.
The session’s output message if one was produced.
Below the overview information follow the test case’s references where, as available, you are provided with links to additional information included as annexes in the report. These may be:
The extended documentation of the test case.
The test session comments (see Comment on a test session), if any were made. In case the administrator overrode the session’s result, their comment is presented with a Forced test result indication.
The test session log.
This first page is followed by the section on the test case’s step reports. All steps are initially presented as an overview including per step, its description and result. The detailed step reports follow this overview, with individual reports being directly accessible by clicking each step’s sequence identifier that prefixes its description.

Each detailed step report includes the following information for its step:
Its sequence number and description in its header, that also includes a link to return to the steps’ overview section.
Its result and completion time.
The number of validation report findings classified as errors, warnings and messages (if applicable).
A report details section listing the details of each validation finding (if applicable).
A report data section listing the step’s input and output. Note that only text values are presented here and are truncated if too long.

At the end of the test case report follow the report’s annexes, specifically the test case’s documentation and the produced log output.

Regarding the log output, this is limited to messages reported at information level thus excluding debugging output that could be quite long for elaborate test cases.

Note
The XML report for a given test session can also be obtained through the Test Bed’s REST API (if enabled for your Test Bed instance).
Export test sessions
Apart from exporting an individual test case report you can also export the information for the currently displayed test sessions in CSV format. To do this click the Export CSV button in the right of the active or completed test session table header.

View test session details
Each row from the list of presented test sessions, both active and completed, may also be clicked to view its detailed information. Doing so expands the row to present the test session’s steps in a manner similar to the live test execution diagram displayed while the test session is active (see Test execution).

In terms of provided controls, each completed step is displayed with a status icon and a status-specific highlight when hovered, and can be clicked to review its details (see View test step details). In addition, the diagram’s header presents the session’s test suite, test case and session identifier. The session identifier may also be clicked to copy it to the clipboard, which could be useful if you would want to communicate it to others or to use it for search filtering. Furthermore, clicking elsewhere on the header of the diagram display will collapse (or expand) the diagram, which could be useful if you want to quickly view other information on the screen.
At the end of the title bar you also find a More button that, when clicked, presents a popup with further information on the session, namely its domain, specification, actor, community, organisation and system, as well as its start time and (for completed sessions) end time.

Above the diagram display you are presented with additional buttons linked to the test session. The purpose of these are as follows:
View log opens up the test session log for display, displaying its contents similarly to when the session is executing.
Copy link copies a shareable external link to focus on the current test session. You also have here a Copy link for administrator option in case you want to share the link with an administrator.
View statement takes you to the relevant conformance statement, with additional options labelled view system to view the related system, and view organisation to view the related organisation.
For completed test sessions you are additionally provided with a View comments button (see Comment on a test session) and, if applicable to your community, a Flag control (see Flag a test session).
In the case of an active test session you are also provided with a button to refresh its display and view pending interactions (in case interactions are pending).

Refreshing the display allows you to track the progress of a specific test session without needing to make a full refresh of the displayed results. Clicking this button will refresh only the relevant test session and reflect changes on its diagram. Note that it is possible that upon refresh, the test session has in the meanwhile completed, in which case a relevant information popup will inform you accordingly. In case of a pending interaction, clicking to view it will present it so that it can be completed and allow the session to proceed. This allows you to have test sessions execute in the background while checking through this screen on whether they need user interactions.
Clicking on the session row will once again collapse the display. Note that once one or more session details are expanded the table’s header will display a Collapse all button that can be clicked to collapse all details.
View test step details
Clicking on a step’s document icon triggers a popup that shows the step’s different information elements that can be viewed inline, downloaded or opened in a separate popup editor. In the case of validation steps, this is extended to also provide the detailed results and report counters as illustrated in the following example for a validation failure.
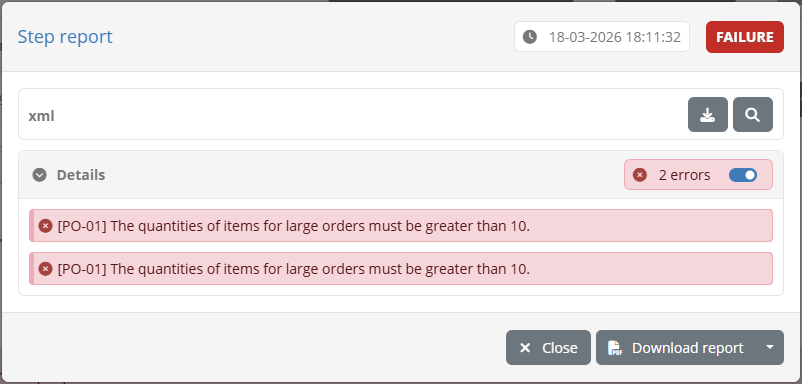
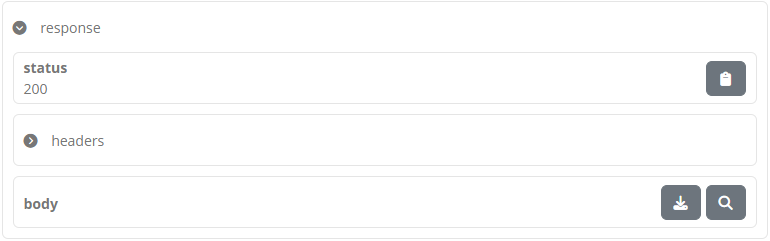
In the test step result popup you are presented with the result and completion time as the step summary. In the sections that follow you can inspect the output information from the step, presented either inline (for short values), as a file you can download, or through a further popup editor. In the latter case this is triggered by clicking the View button. Clicking to open this, displays its content which, in the case of validation steps, is also highlighted for the recorded validation messages.
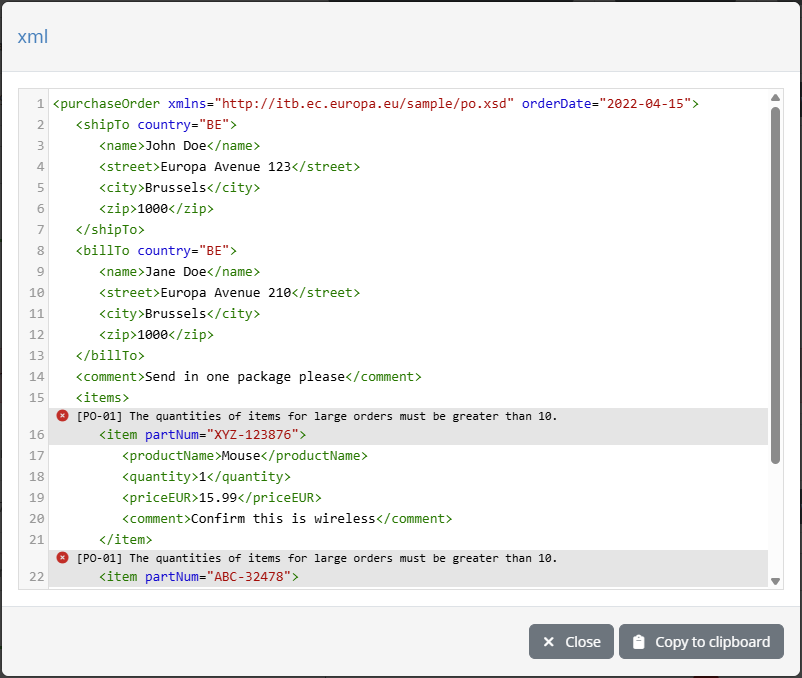
The editor popup allows you to copy a specific part of the content or, by means of the Copy to clipboard button, copy its entire contents. The Close button closes this popup and returns you to the test step result display. Note that clicking on a specific error will open the validated content and automatically focus on the selected error.
An alternative to viewing the content in this way is to click the Download button which will download the content as a file. The Test Bed will determine the most appropriate type for the content and name the downloaded file accordingly (if possible). In the case of simple texts that are presented inline, you are not presented with the download and view buttons, but rather with a Copy to clipboard button that allows you to copy the presented value.
Note
Viewing binary output: Images are presented as a preview when selecting to view them. For other binary content (e.g. a PDF document), the best way to inspect it is to download it. Opening such content in the in-place code editor will still be possible, but this will most likely not be useful.
Export test step report
The results of the test step can also be exported as a test step report in PDF and XML formats. This is made available through the Download report button for PDF, and its Download report as XML additional option for XML, that will trigger the generation and download of the report in the requested format. The following example represents such a report in PDF.
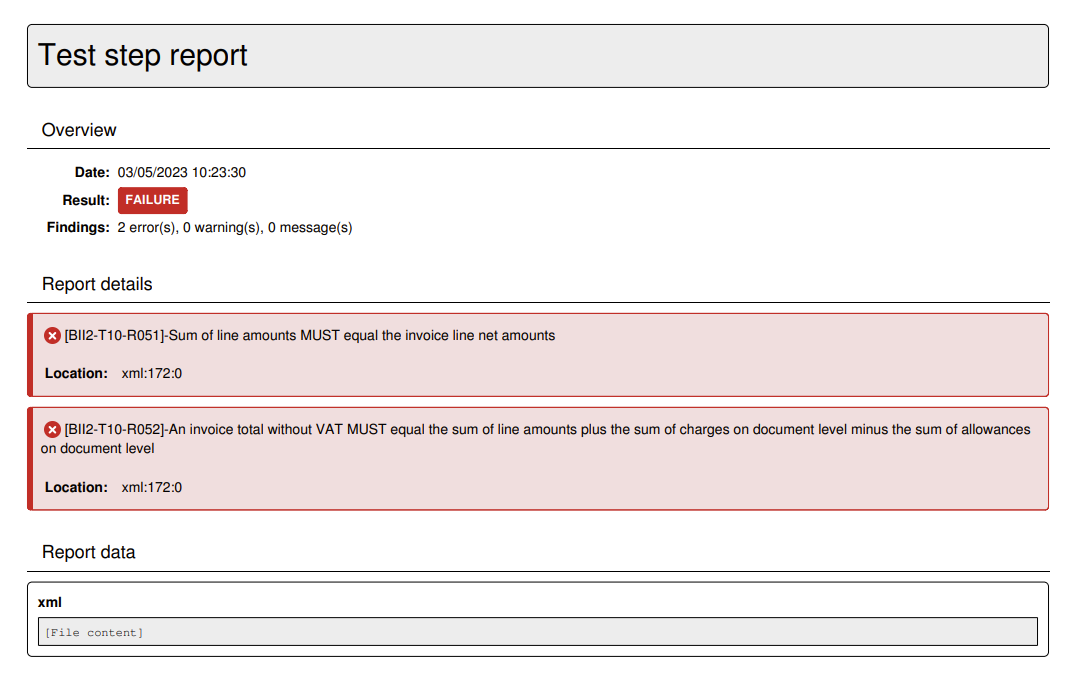
This PDF report includes:
The test step result overview, including the result, date and, in case of a validation step, the total number of validation findings (classified as errors, warnings and messages).
The report details, included in case of a validation step to list the details of the validation report’s findings.
When selecting to download the report as XML, you receive similar information but represented in XML for simpler machine-processing. The structure of the report is defined by the GITB Test Reporting Language (GITB TRL), with the following being a simple sample:
<?xml version="1.0" encoding="UTF-8" standalone="yes"?>
<TestStepReport xmlns="http://www.gitb.com/tr/v1/" xmlns:ns2="http://www.gitb.com/core/v1/" xmlns:ns3="http://www.gitb.com/tbs/v1/" xmlns:xsi="http://www.w3.org/2001/XMLSchema-instance" xsi:type="TAR" name="Schematron Validation" id="4">
    <date>2022-10-14T15:21:30.250+02:00</date>
    <result>FAILURE</result>
    <counters>
        <nrOfAssertions>0</nrOfAssertions>
        <nrOfErrors>2</nrOfErrors>
        <nrOfWarnings>0</nrOfWarnings>
    </counters>
    <reports>
        <error xsi:type="BAR">
            <description>[BII2-T10-R051]-Sum of line amounts MUST equal the invoice line net amounts</description>
            <location>xml:172:0</location>
        </error>
        <error xsi:type="BAR">
            <description>[BII2-T10-R052]-An invoice total without VAT MUST equal the sum of line amounts plus the sum of charges on document level minus the sum of allowances on document level</description>
            <location>xml:172:0</location>
        </error>
    </reports>
</TestStepReport>
Flag a test session
Your community administrator may define test session flags to support community-specific workflows, for example to mark test sessions for follow-up or to categorise them. If your community defines flags, a Flag control (see View test session details) is presented for expanded completed test sessions, allowing you to set one of the available flags, or to Clear flag once one is set.

The assigned flag, if any, is displayed as a coloured tag on the session and can also be shown as a Flag column (see Adapt the displayed columns) and filtered for (see Apply search filters).
Note
Some flags may be restricted by your community administrator so that they can only be set, changed or cleared by administrators. If a session carries such a flag you will still see it, but will not be able to change or clear it.
Comment on a test session
For completed test sessions you can exchange comments with your community’s administrators, providing context on the test session, for example to explain a failure or to discuss its significance. To view or add a comment click the View comments button presented for an expanded session (see View test session details). This button displays a badge whenever the session already has one or more comments.
Your organisation has a single comment for the test session, which may be added, edited or deleted by any user of your organisation using the Add comment (or Edit comment) and Delete buttons. Comments are written using rich text. Separately, an administrator may also add their own comment to the session, which is presented distinctly and labelled as coming from the Administrator.
Note
Comments on other organisations’ sessions: When viewing a session that does not belong to your organisation (for example from the community test history screen), comments can be viewed but not added, edited or deleted. The same applies to comments on obsolete test sessions.
Depending on your community’s configuration, an administrator may also:
Prevent further comment updates by you. In this case you will see an informational message in the dialog and the option to add or edit your comment will no longer be presented.
Override the test session’s result and output message. When this is done, the administrator’s comment is presented with an indication such as Success (forced) or Failure (forced), and the session’s displayed result and output message are updated accordingly. This may also affect the status of your related conformance statement.